As an investment portfolio grows, so does the work of tracking it. A few stocks in one brokerage account turn into ETFs, international shares, crypto, and sometimes real estate or private equity — and the spreadsheet that once worked starts to creak.
Snowball Analytics and Capitally are two European portfolio trackers built to solve that, and they take opposite approaches. Snowball automates data collection through bank-style account aggregation; Capitally keeps your data on your device behind end-to-end encryption and imports from broker statements instead. This review compares them on privacy, asset coverage, analytics, tax, and price — and ends with a clear recommendation for who each one fits.
Table of Contents
- Snowball Analytics vs Capitally: the short answer
- Is Snowball Analytics safe? Privacy and security compared
- Asset coverage: what you can actually track
- Data import: aggregator sync vs broker statements
- Multi-currency support and international investing
- Performance analysis and reporting
- Tax reporting and cost basis
- Portfolio strategies and planning
- User experience and platform access
- Pricing and value compared
- Snowball Analytics vs Capitally: which should you choose?
Snowball Analytics vs Capitally: the short answer
Capitally is the stronger choice for privacy-conscious investors with complex portfolios — alternative assets, options, liabilities, multi-currency holdings, and serious tax needs — because it keeps your data end-to-end encrypted on your device and treats each of those as a first-class asset type. Snowball Analytics is the better fit for investors with mainstream holdings who want automated account syncing, native mobile apps, and built-in rebalancing and goal-planning tools.
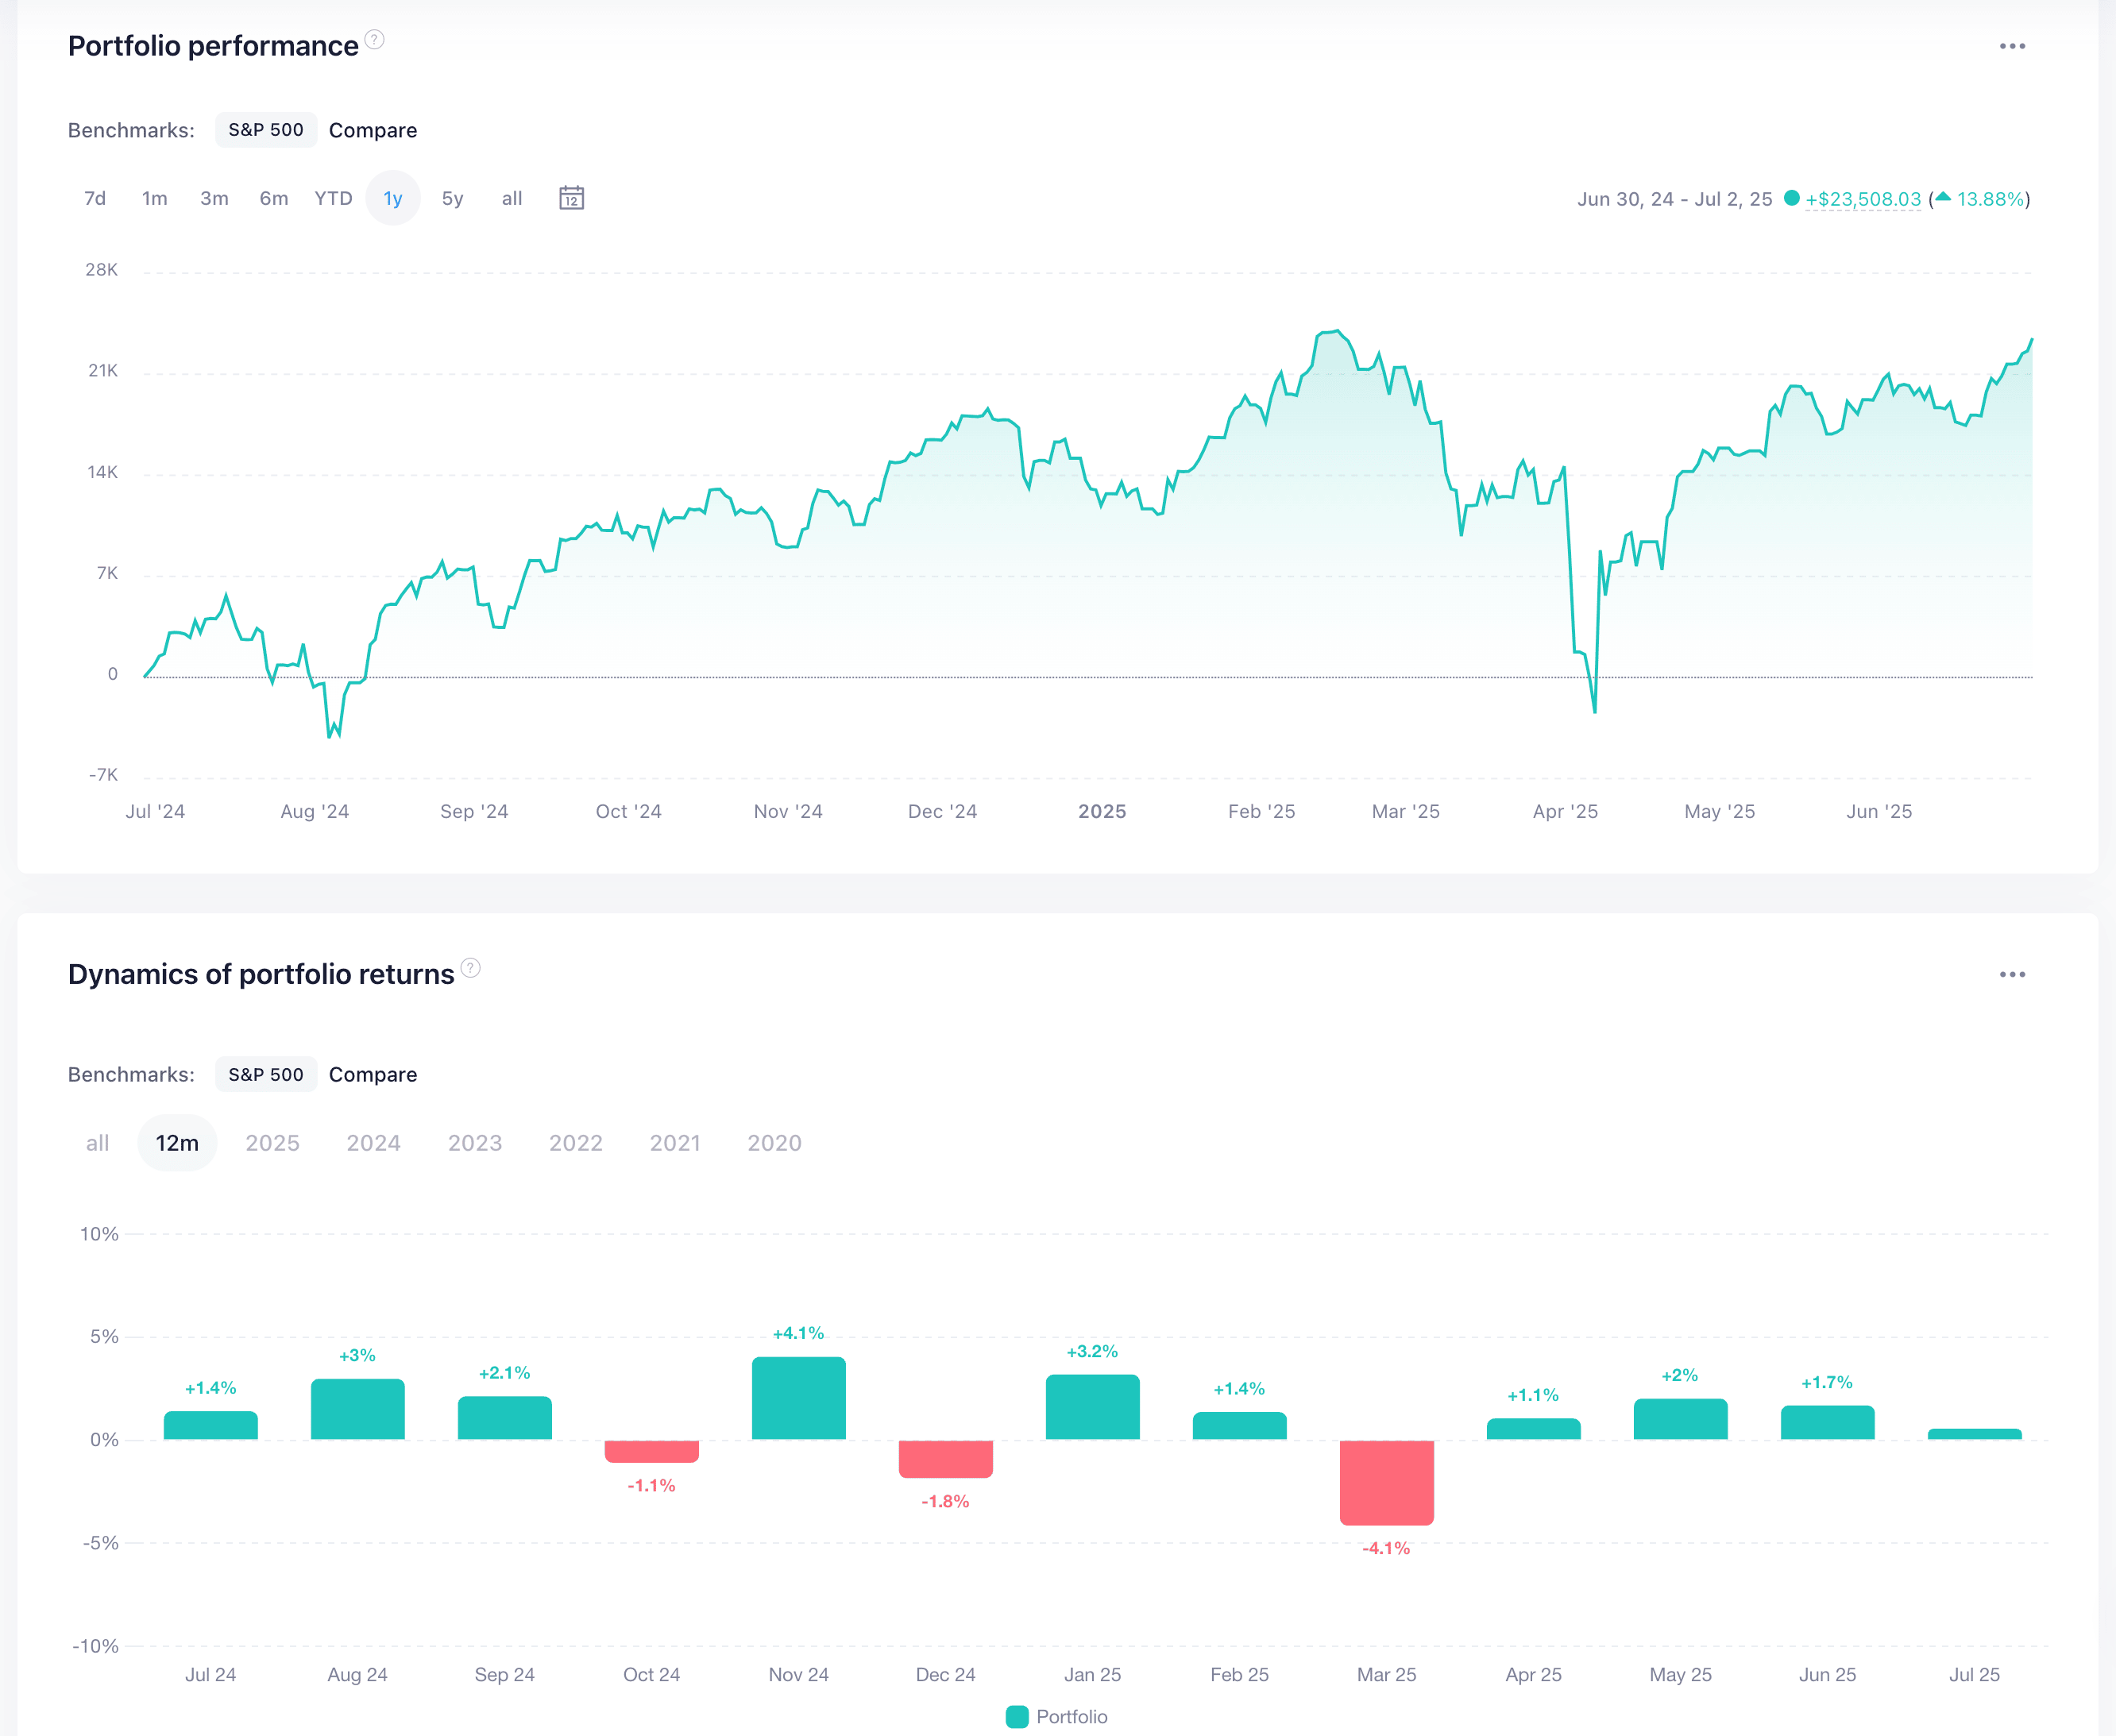
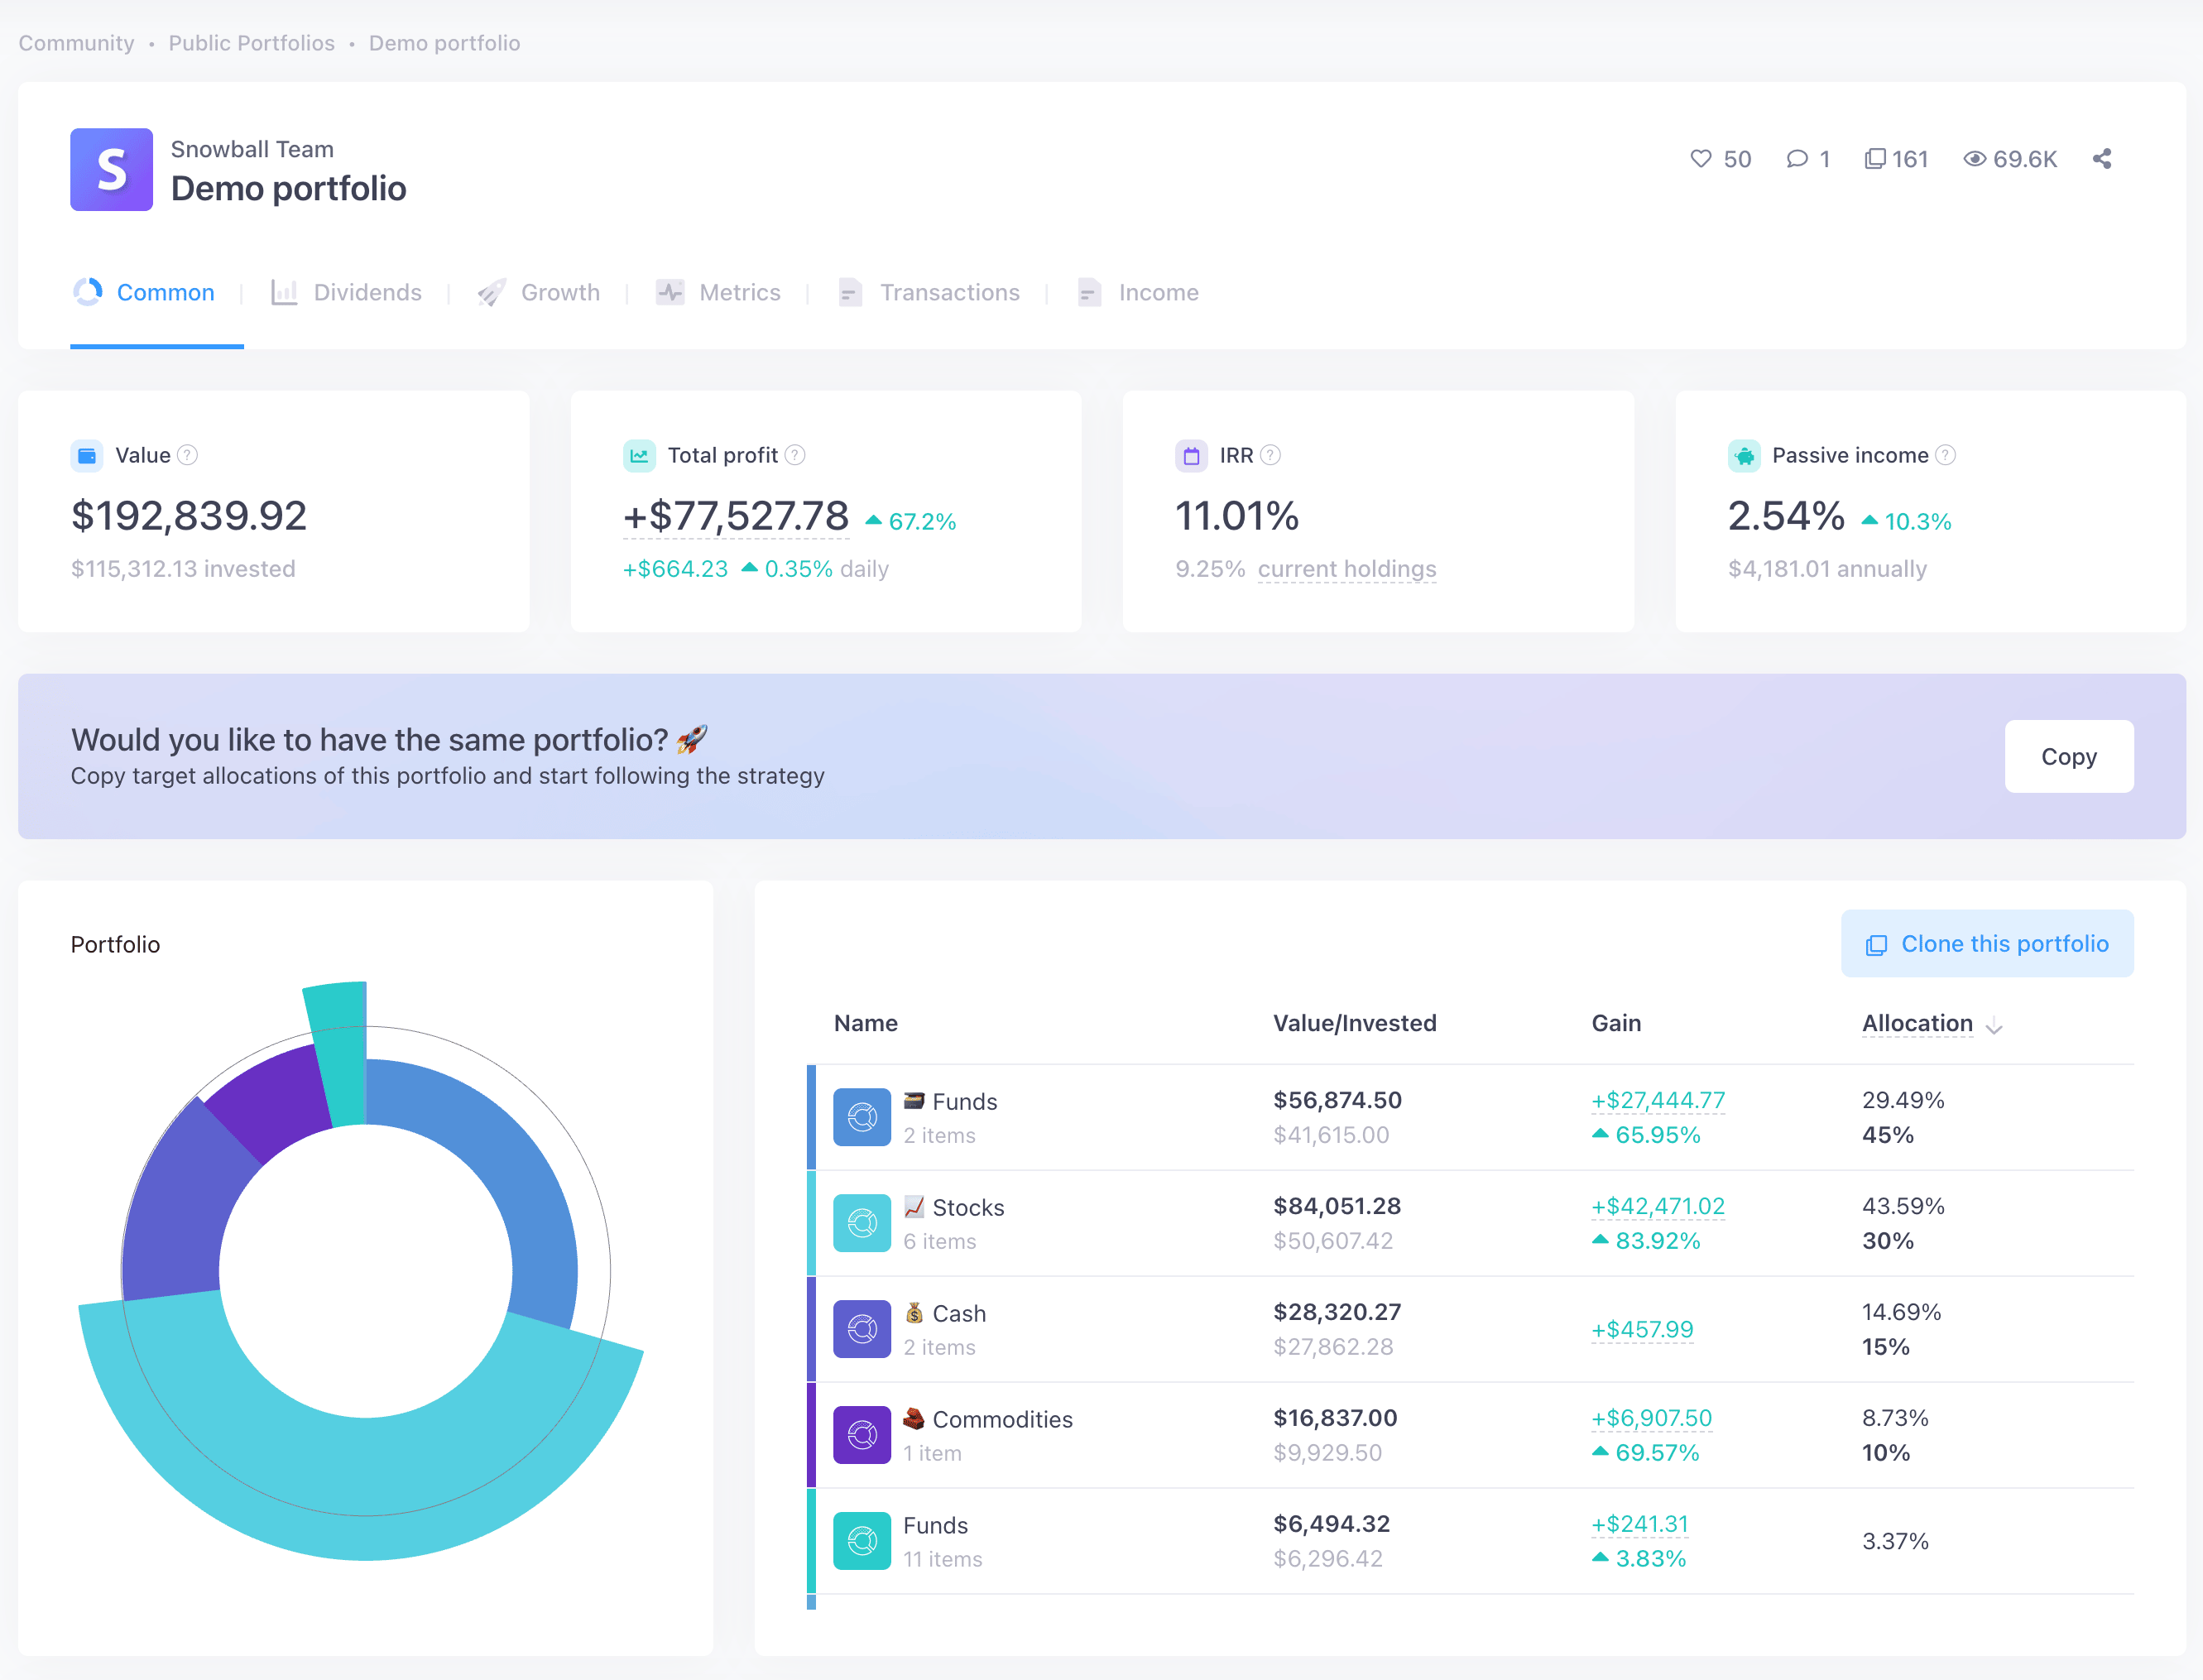 Snowball dashboard
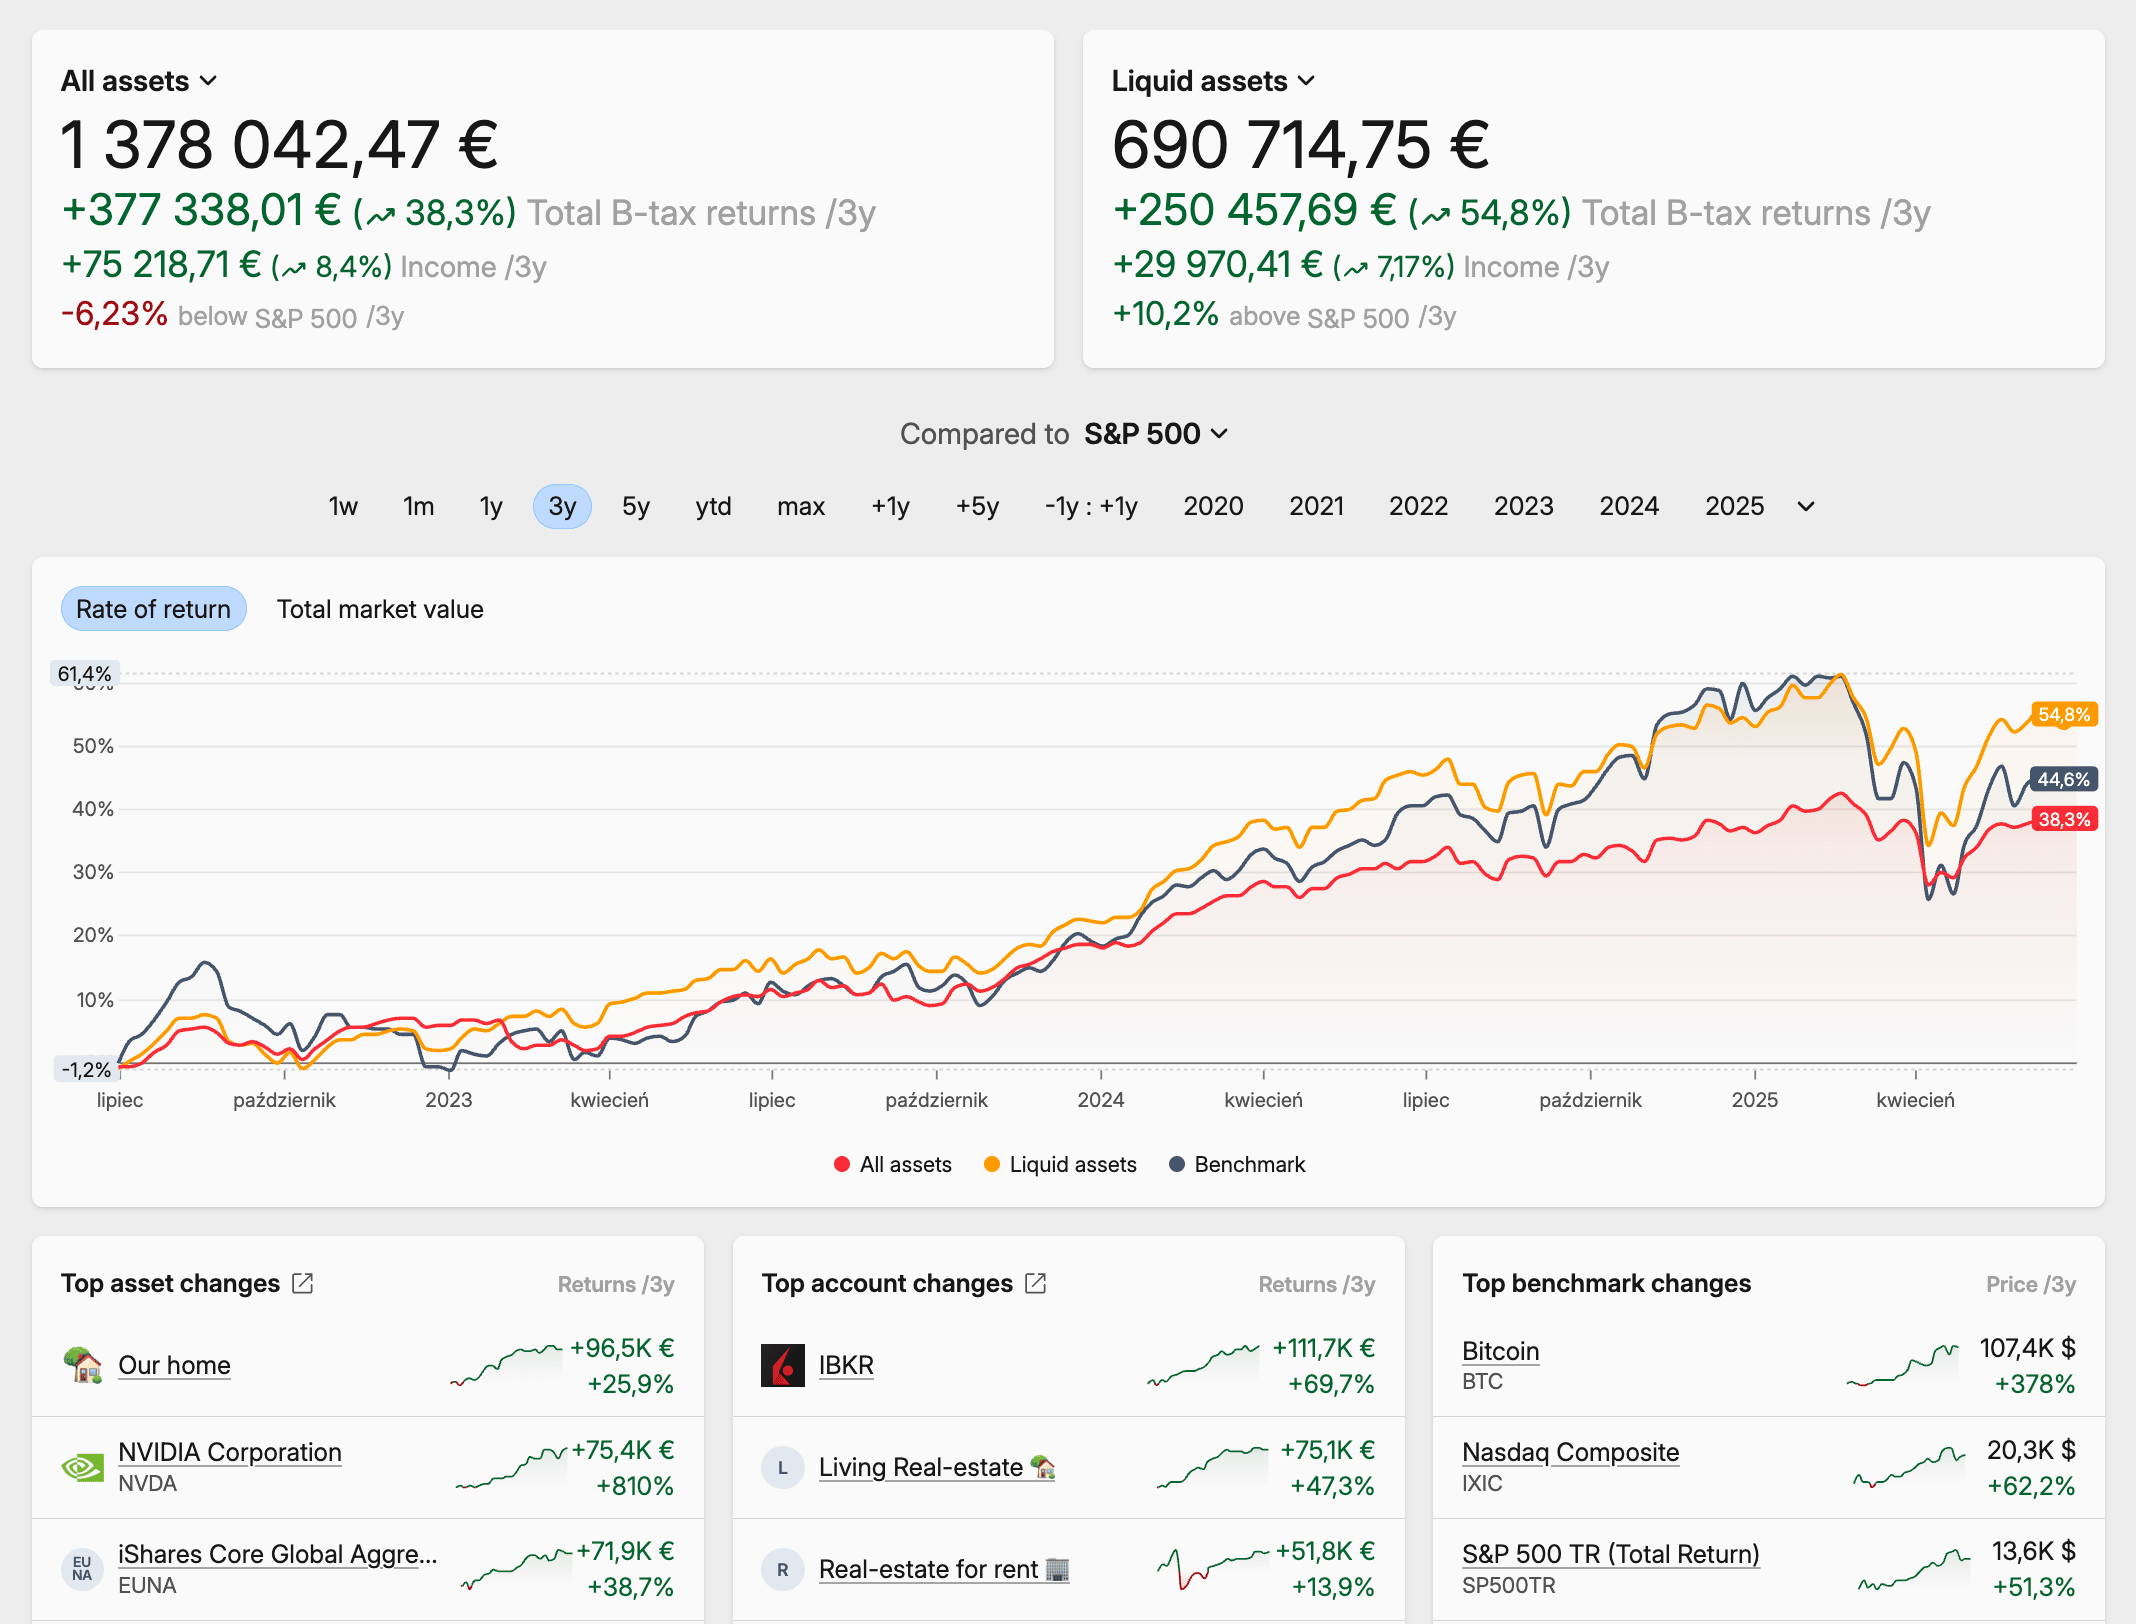 Capitally dashboard
Here's how the two compare at a glance:
Feature | Snowball Analytics | Capitally |
|---|---|---|
Data import | Automated sync via Yodlee, SnapTrade & native Interactive Brokers, plus manual CSV (~15 brokers) | Manual import from 70+ brokers, exchanges & apps, plus reusable custom importers |
Privacy | Standard server-side encryption; third-party analytics & ad trackers present | End-to-end encryption, on-device processing, no third-party trackers |
Asset types | Stocks, ETFs, funds, crypto, cash; real estate, P2P & collectibles as untyped custom assets | All of those as first-class types, plus real estate, private equity, art, P2P loans, derivatives & any custom asset |
Liability tracking | ❌ Not supported | First-class — mortgages, loans, margin, short positions |
Multi-Currency | Yes, converted to one base currency | Yes, with separate currency-vs-capital return attribution |
Mobile access | Native iOS & Android apps | Progressive Web App — installable, works offline |
Tax support | ❌ Dividend withholding tax only. | Capital gains with FIFO, LIFO, Average Cost (ACB), Highest/Lowest Cost, manual lot selection; presets for 11+ jurisdictions |
Option tracking | ❌ Not supported | Full options support (calls, puts, strategies, Greeks) — Captain plan |
Portfolio strategies | Rebalancing, allocation backtesting, goal planning | Allocation & exposure analysis, what-if projects; rebalancing on the roadmap |
Pricing | Free tier; paid $7.99–$24.99/month or $79.99–$249.99/year | €80–€250/year across three plans |
Best for | Mainstream portfolios, automation, structured strategy tools | Complex portfolios, privacy, hands-on control, deep tax & analytics |
Is Snowball Analytics good? It's a capable, actively developed tracker, and for mainstream portfolios it does the job well. Whether it's the right choice comes down to what you hold — and how much you value privacy and hands-on control.
What Snowball Analytics does well:
- Automated account syncing via Yodlee, SnapTrade, and a native Interactive Brokers integration
- Native iOS and Android apps with home-screen widgets
- A proprietary Dividend Rating, a dividend calendar, and a 12-month payout forecast
- Structured strategy tools — rebalancing, allocation backtesting, and goal planning
- A free tier and a gentle learning curve
Where it falls short:
- No support for liabilities, options, or short positions
- No cost-basis methods (FIFO, ACB, and similar) for capital-gains tax
- Real estate and private equity exist only as untyped custom assets
- Standard server-side encryption, plus third-party analytics and ad trackers
- No offline access
Is Snowball Analytics safe? Privacy and security compared
Both trackers host data in Europe under GDPR, but they protect it very differently. Capitally encrypts your financial data end-to-end on your own device — the key is derived from your password and never leaves the device, so no one at Capitally can read your data. Snowball Analytics uses standard server-side encryption, which means its operators can technically access decrypted data.
Snowball Analytics takes the conventional approach. Data is encrypted in transit and at rest, and the platform offers two-factor authentication. Two details matter for security-conscious investors, though. To enable automatic syncing you often have to hand your bank or broker credentials to a third-party aggregator — Yodlee or SnapTrade — so your financial data and often login details pass through another company's systems.
Capitally took a different path. It uses on-device, end-to-end encryption: your financial data is encrypted on your device with a key derived from your password, and that key never leaves the device. Calculations run locally, not on a server. The practical result is that even Capitally's own employees cannot see your financial data. You can also export everything at any time, so there's no lock-in.
For high-net-worth investors, or anyone handling sensitive financial information, this is the difference between trusting a company to protect your data and making it mathematically impossible for them to read it in the first place.
Asset coverage: what you can actually track
Capitally treats real estate, private equity, options, loans, and mortgages as first-class asset types, each with behaviour specific to that class. Snowball Analytics natively covers stocks, ETFs, funds, crypto, and cash; anything else — a rental property, a PE stake, a P2P loan — lives as an untyped custom asset with a manually updated value. Both handle mainstream securities well; the gap opens up beyond them.
Stocks, ETFs and funds: solid on both
For listed stocks, ETFs, and mutual funds, both platforms do the job. They track dividends, handle stock splits, and calculate performance. Snowball adds a proprietary "Dividend Rating" to flag stable income payers, and its X-Ray feature looks through ETFs and funds to show your true exposure to the underlying holdings. Capitally indexes 400,000+ instruments worldwide and auto-classifies them by region, sector, and category — taxonomies you can then edit. Bonds and options are first-class types in Capitally; in Snowball they show up as untyped custom holdings during a broker sync. The real test comes when you venture beyond listed securities.
Alternative investments: where flexibility matters
This is where the platforms diverge. Say you own a rental property in Munich generating €2,000 a month. In Snowball Analytics, you create a custom asset for it and update its value manually. Since November 2025 you can tag that custom asset with a country and sector, so it shows up in your diversification reports — a genuine improvement — but it's still a generic container. Snowball doesn't model it as real estate: there's no distinct rental-income handling, and no mortgage attached to it.
Capitally treats real estate as a first-class asset type. You track the property value, the rental income (labelled as rental income, not disguised as a dividend), and the mortgage against it. The platform understands that rent behaves differently from a dividend, which changes how it appears in your income forecasts and tax calculations. The same applies to private equity — Capitally has a dedicated PE asset type with a full limited-partner lifecycle (capital calls, distributions, NAV) — as well as art, collectibles, ventures, P2P loans, and any custom asset you define, each taggable by category, region, and sector.
Practical example
You hold a closed-end fund focused on European renewable energy. In Snowball, it's a custom asset with a manually updated price; since November 2025 you can tag it with a country and sector so it appears in your geographic and industry breakdowns. In Capitally, you can do that and treat it as a proper holding — assign it your own categories ("Closed-end fund", "Energy") and the "Europe" region, log its distributions as such, and let the platform fold them into your income calendar. When you later analyze sector exposure, the fund appears exactly where it should, with its real cashflow history behind it.
Option Traders
If you trade options, Capitally is one of the only personal portfolio trackers offering end-to-end options support. Track calls, puts, and complex multi-leg strategies with full Greeks, Black-Scholes-Merton and Barone-Adesi-Whaley pricing, automatic strategy recognition, and margin tracking. Snowball Analytics does not support option contracts — when a broker sync detects one, it's added as an untyped custom holding.
Liabilities: the other half of net worth
Here the platforms differ completely. Snowball Analytics doesn't track liabilities at all — loans, mortgages, margin debt, and short positions aren't part of its portfolio model. If you carry any of those, your complete net-worth picture goes back to a spreadsheet.
Capitally treats liabilities as part of your financial reality. It has dedicated Loan and Mortgage asset types with automatic interest accruals, amortization schedules, adjustable rates, day-count conventions, balloon payments, and payment holidays. Any asset can also become a liability when its quantity goes negative — short sales and margin. You get portfolio metrics like Owed, Owned, and Debt Ratio, plus a margin-requirement line for shorts and short options.
This matters more than it sounds. A property worth €800,000 with a €500,000 mortgage contributes €300,000 to your net worth, not €800,000. For leveraged investors — or anyone with significant debt — seeing only the asset side is a dangerously incomplete picture.
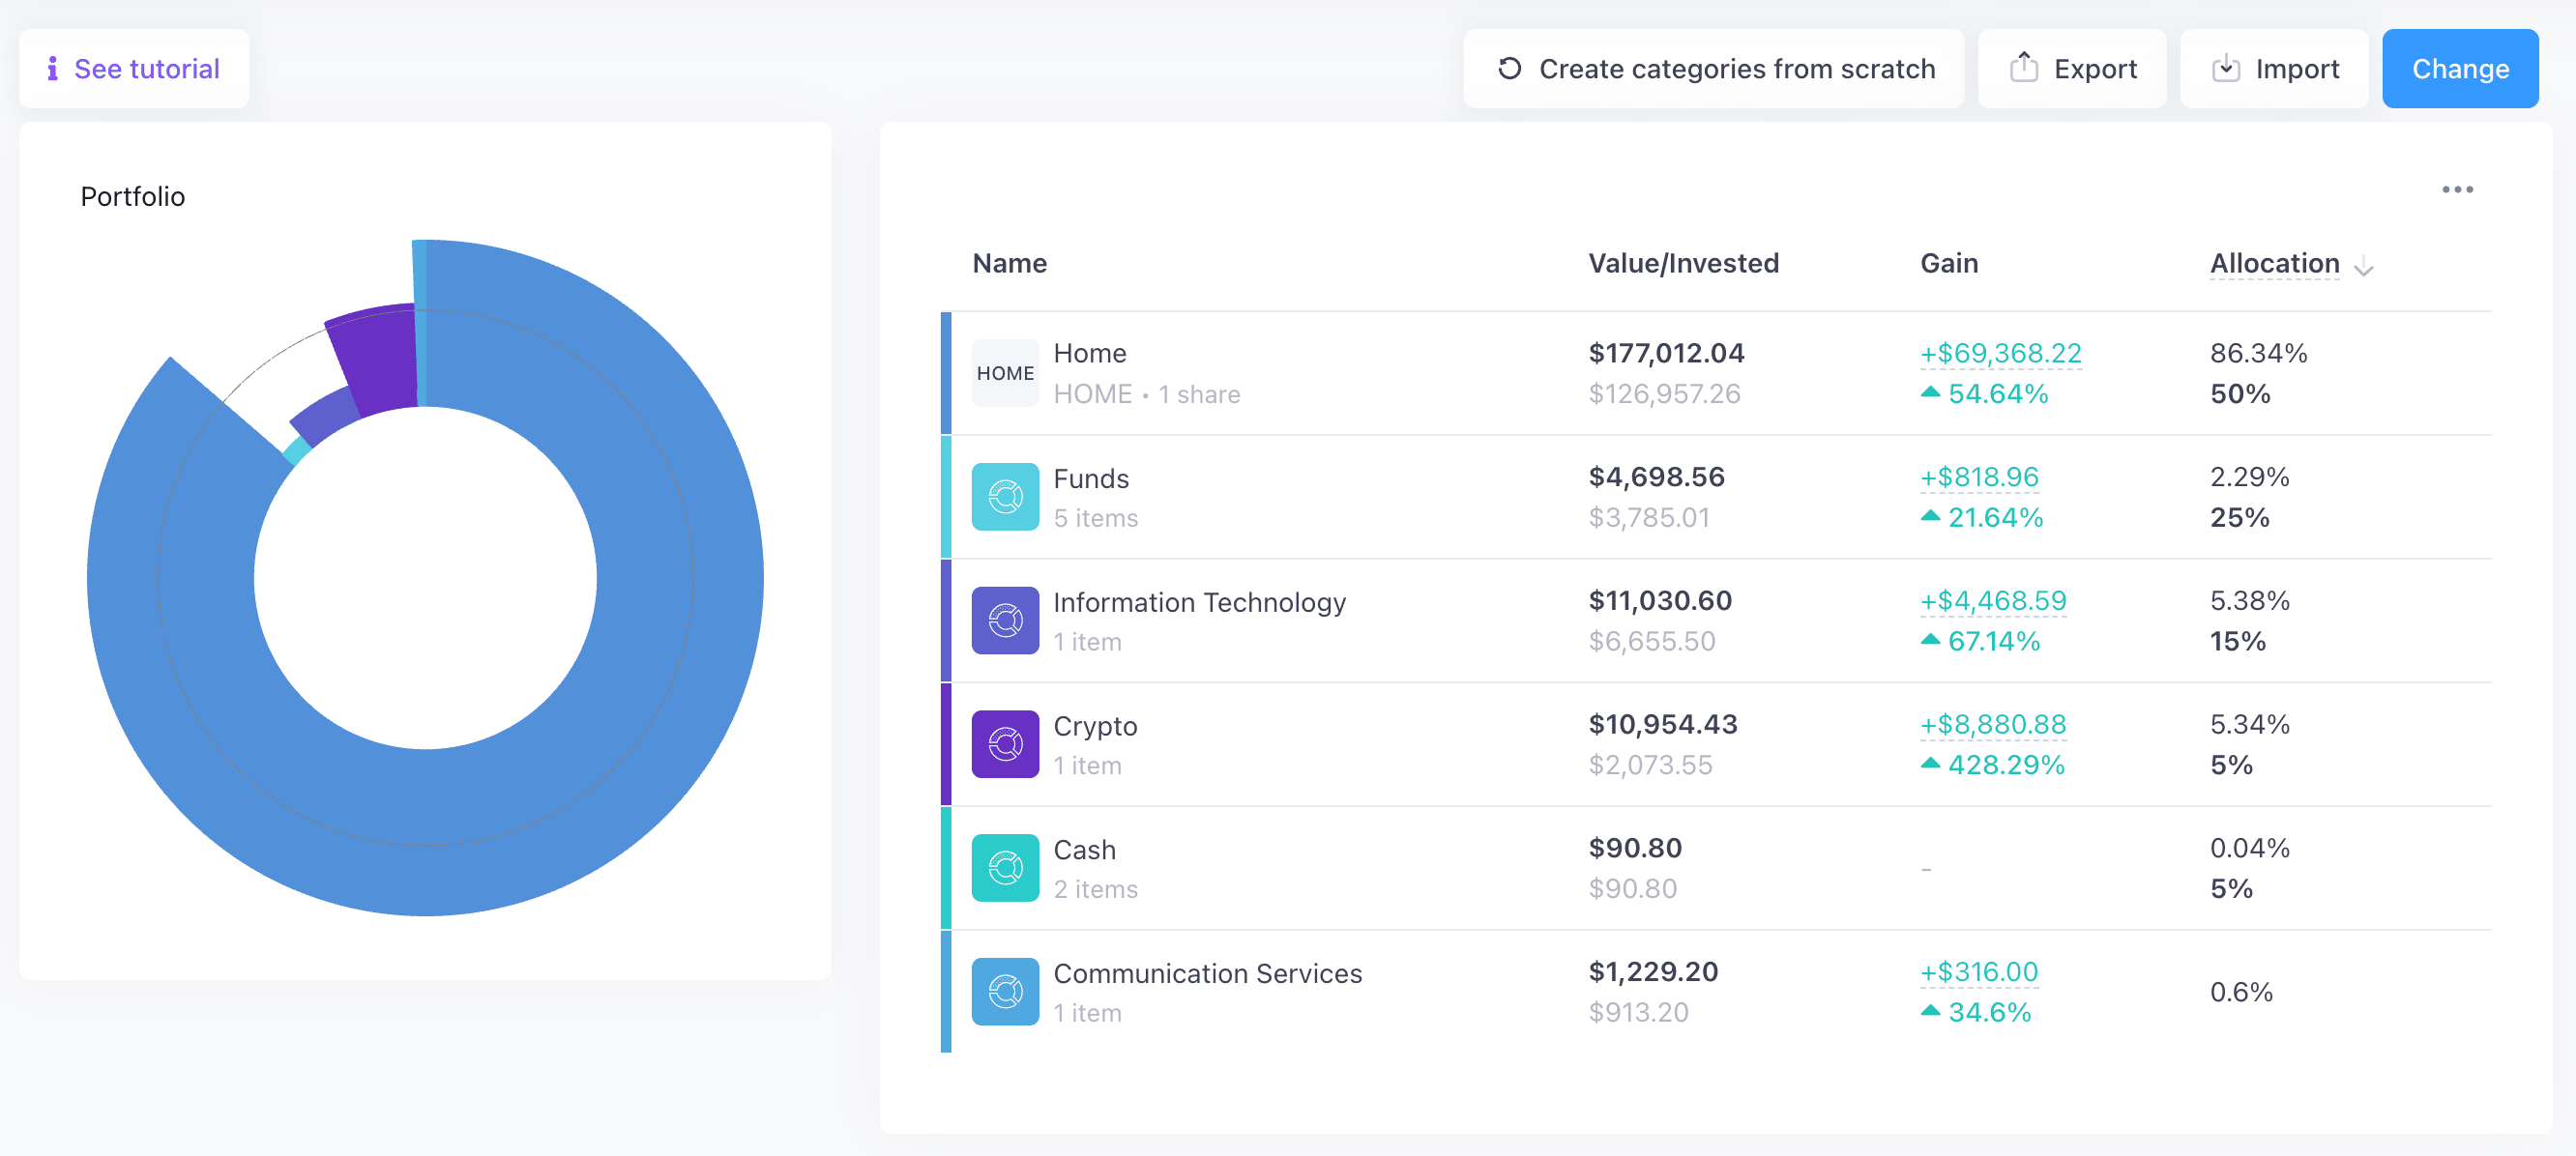
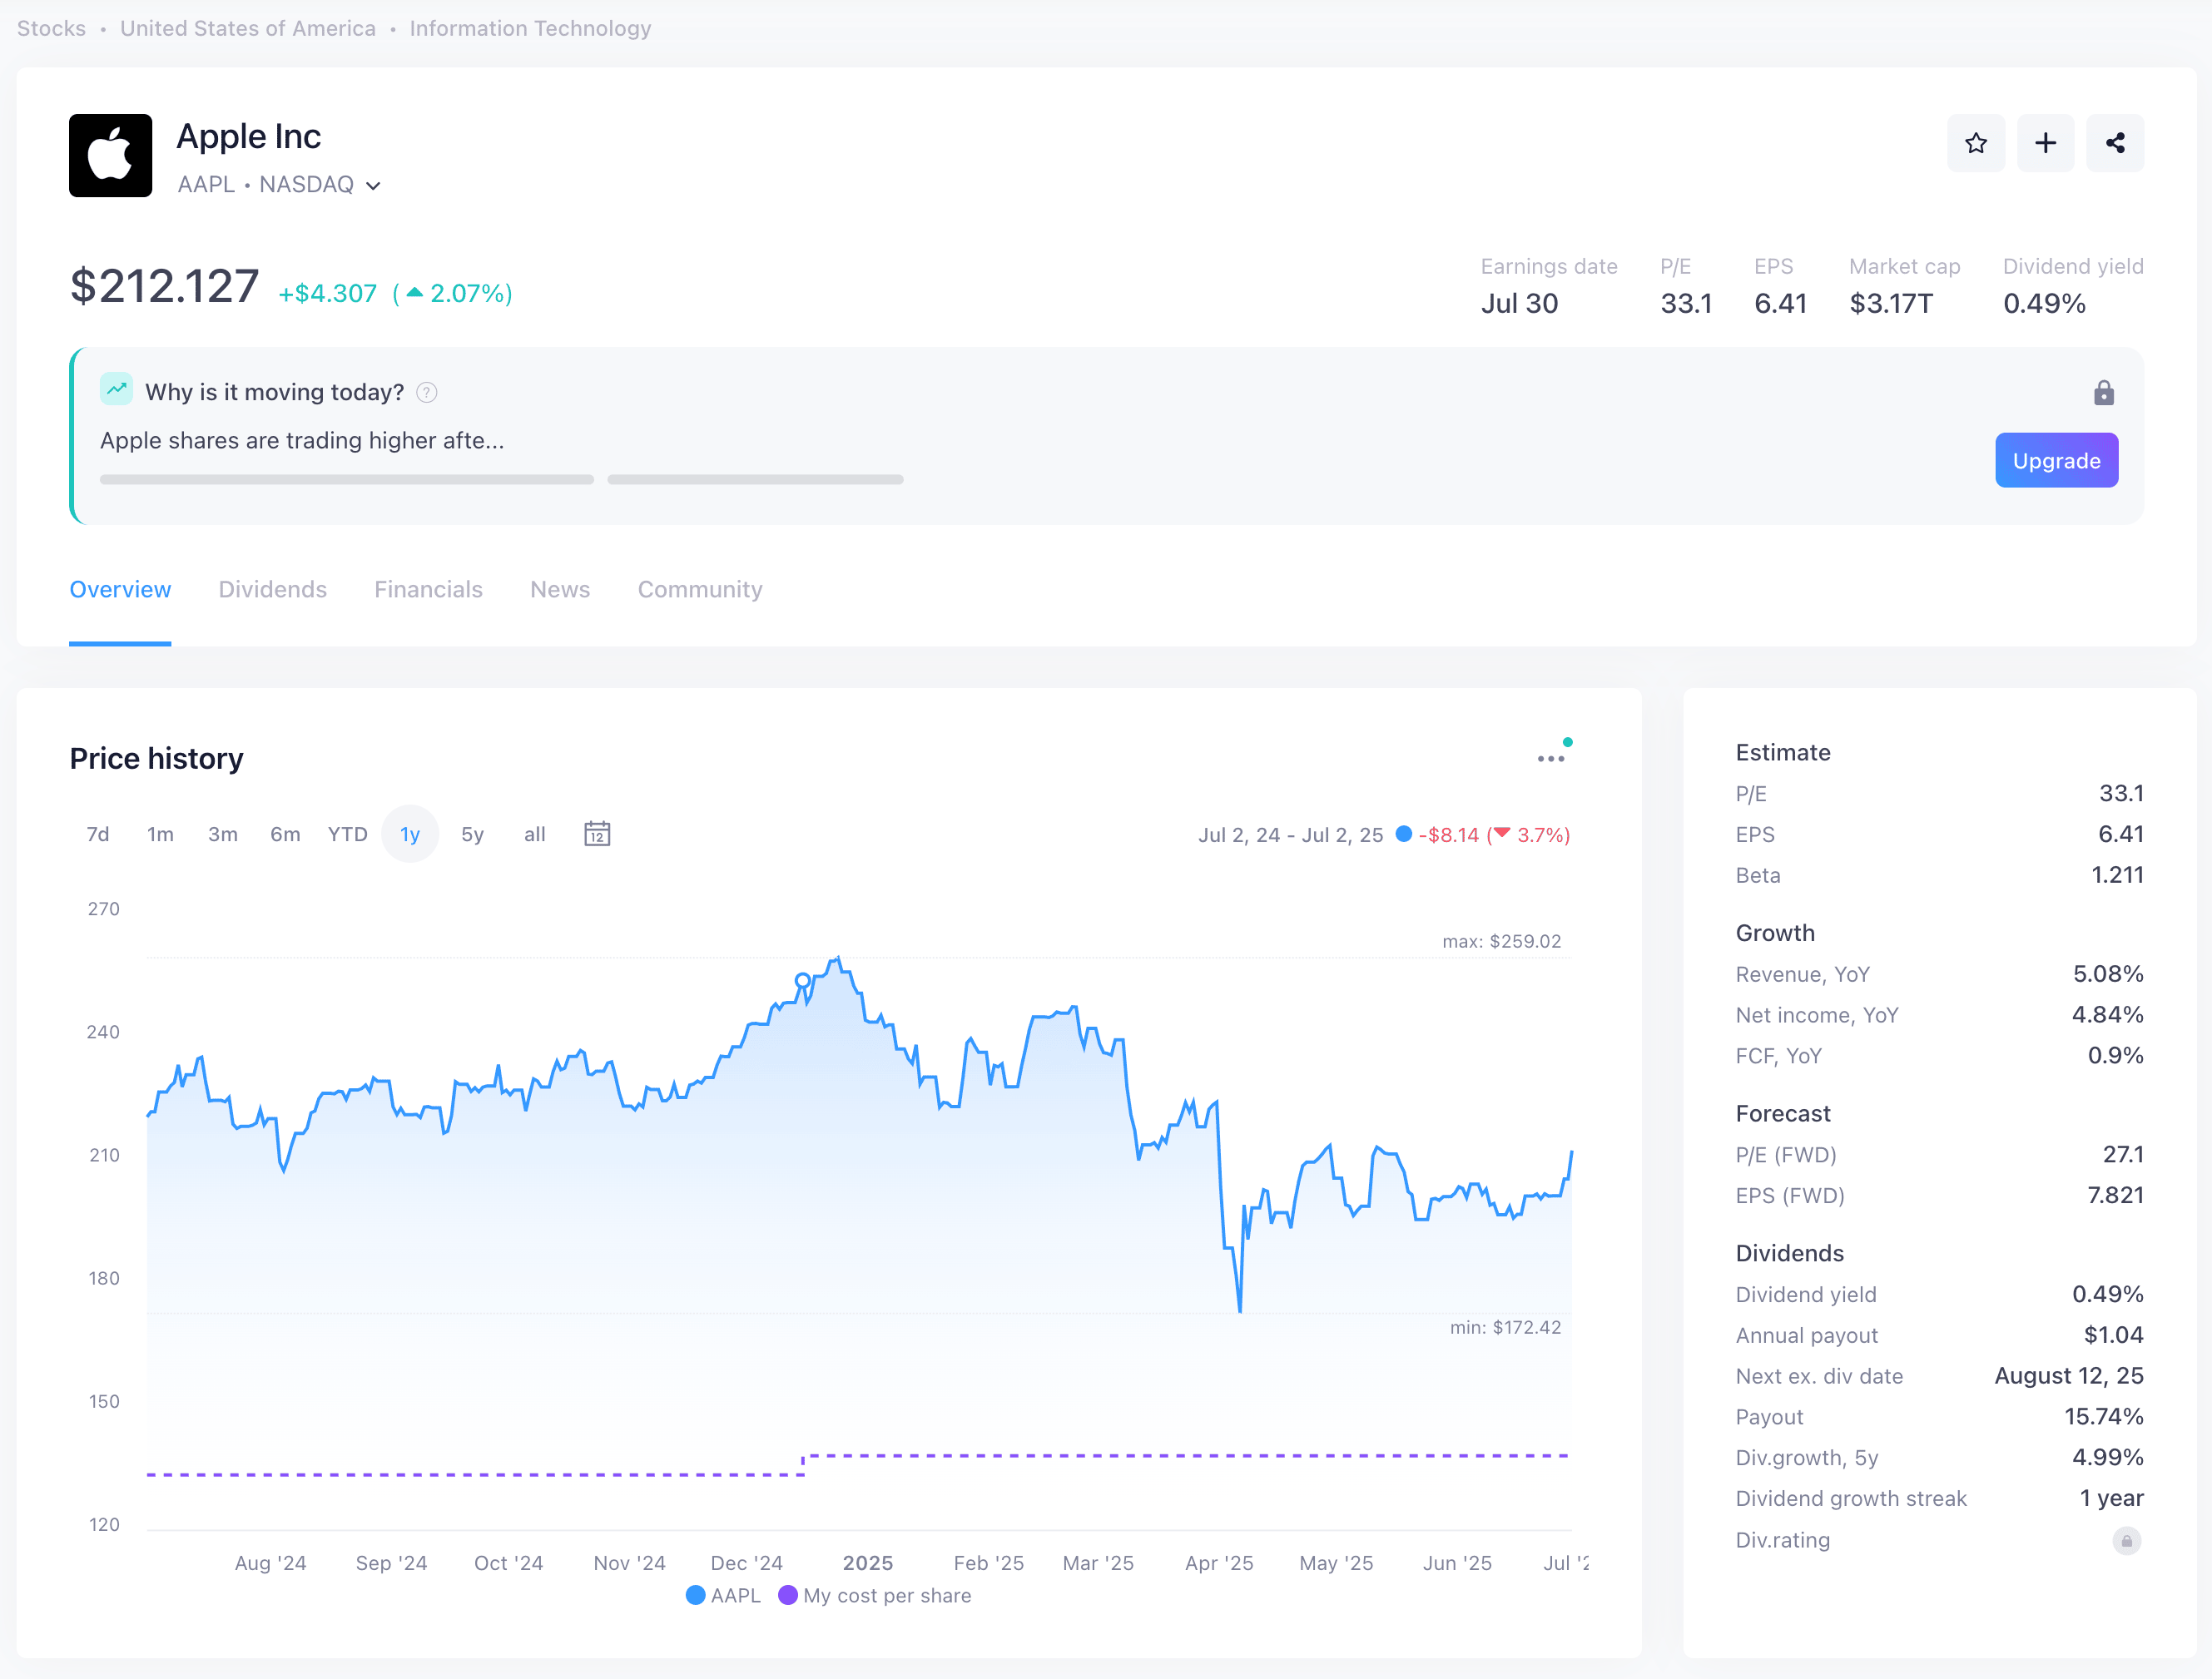 Snowball asset page
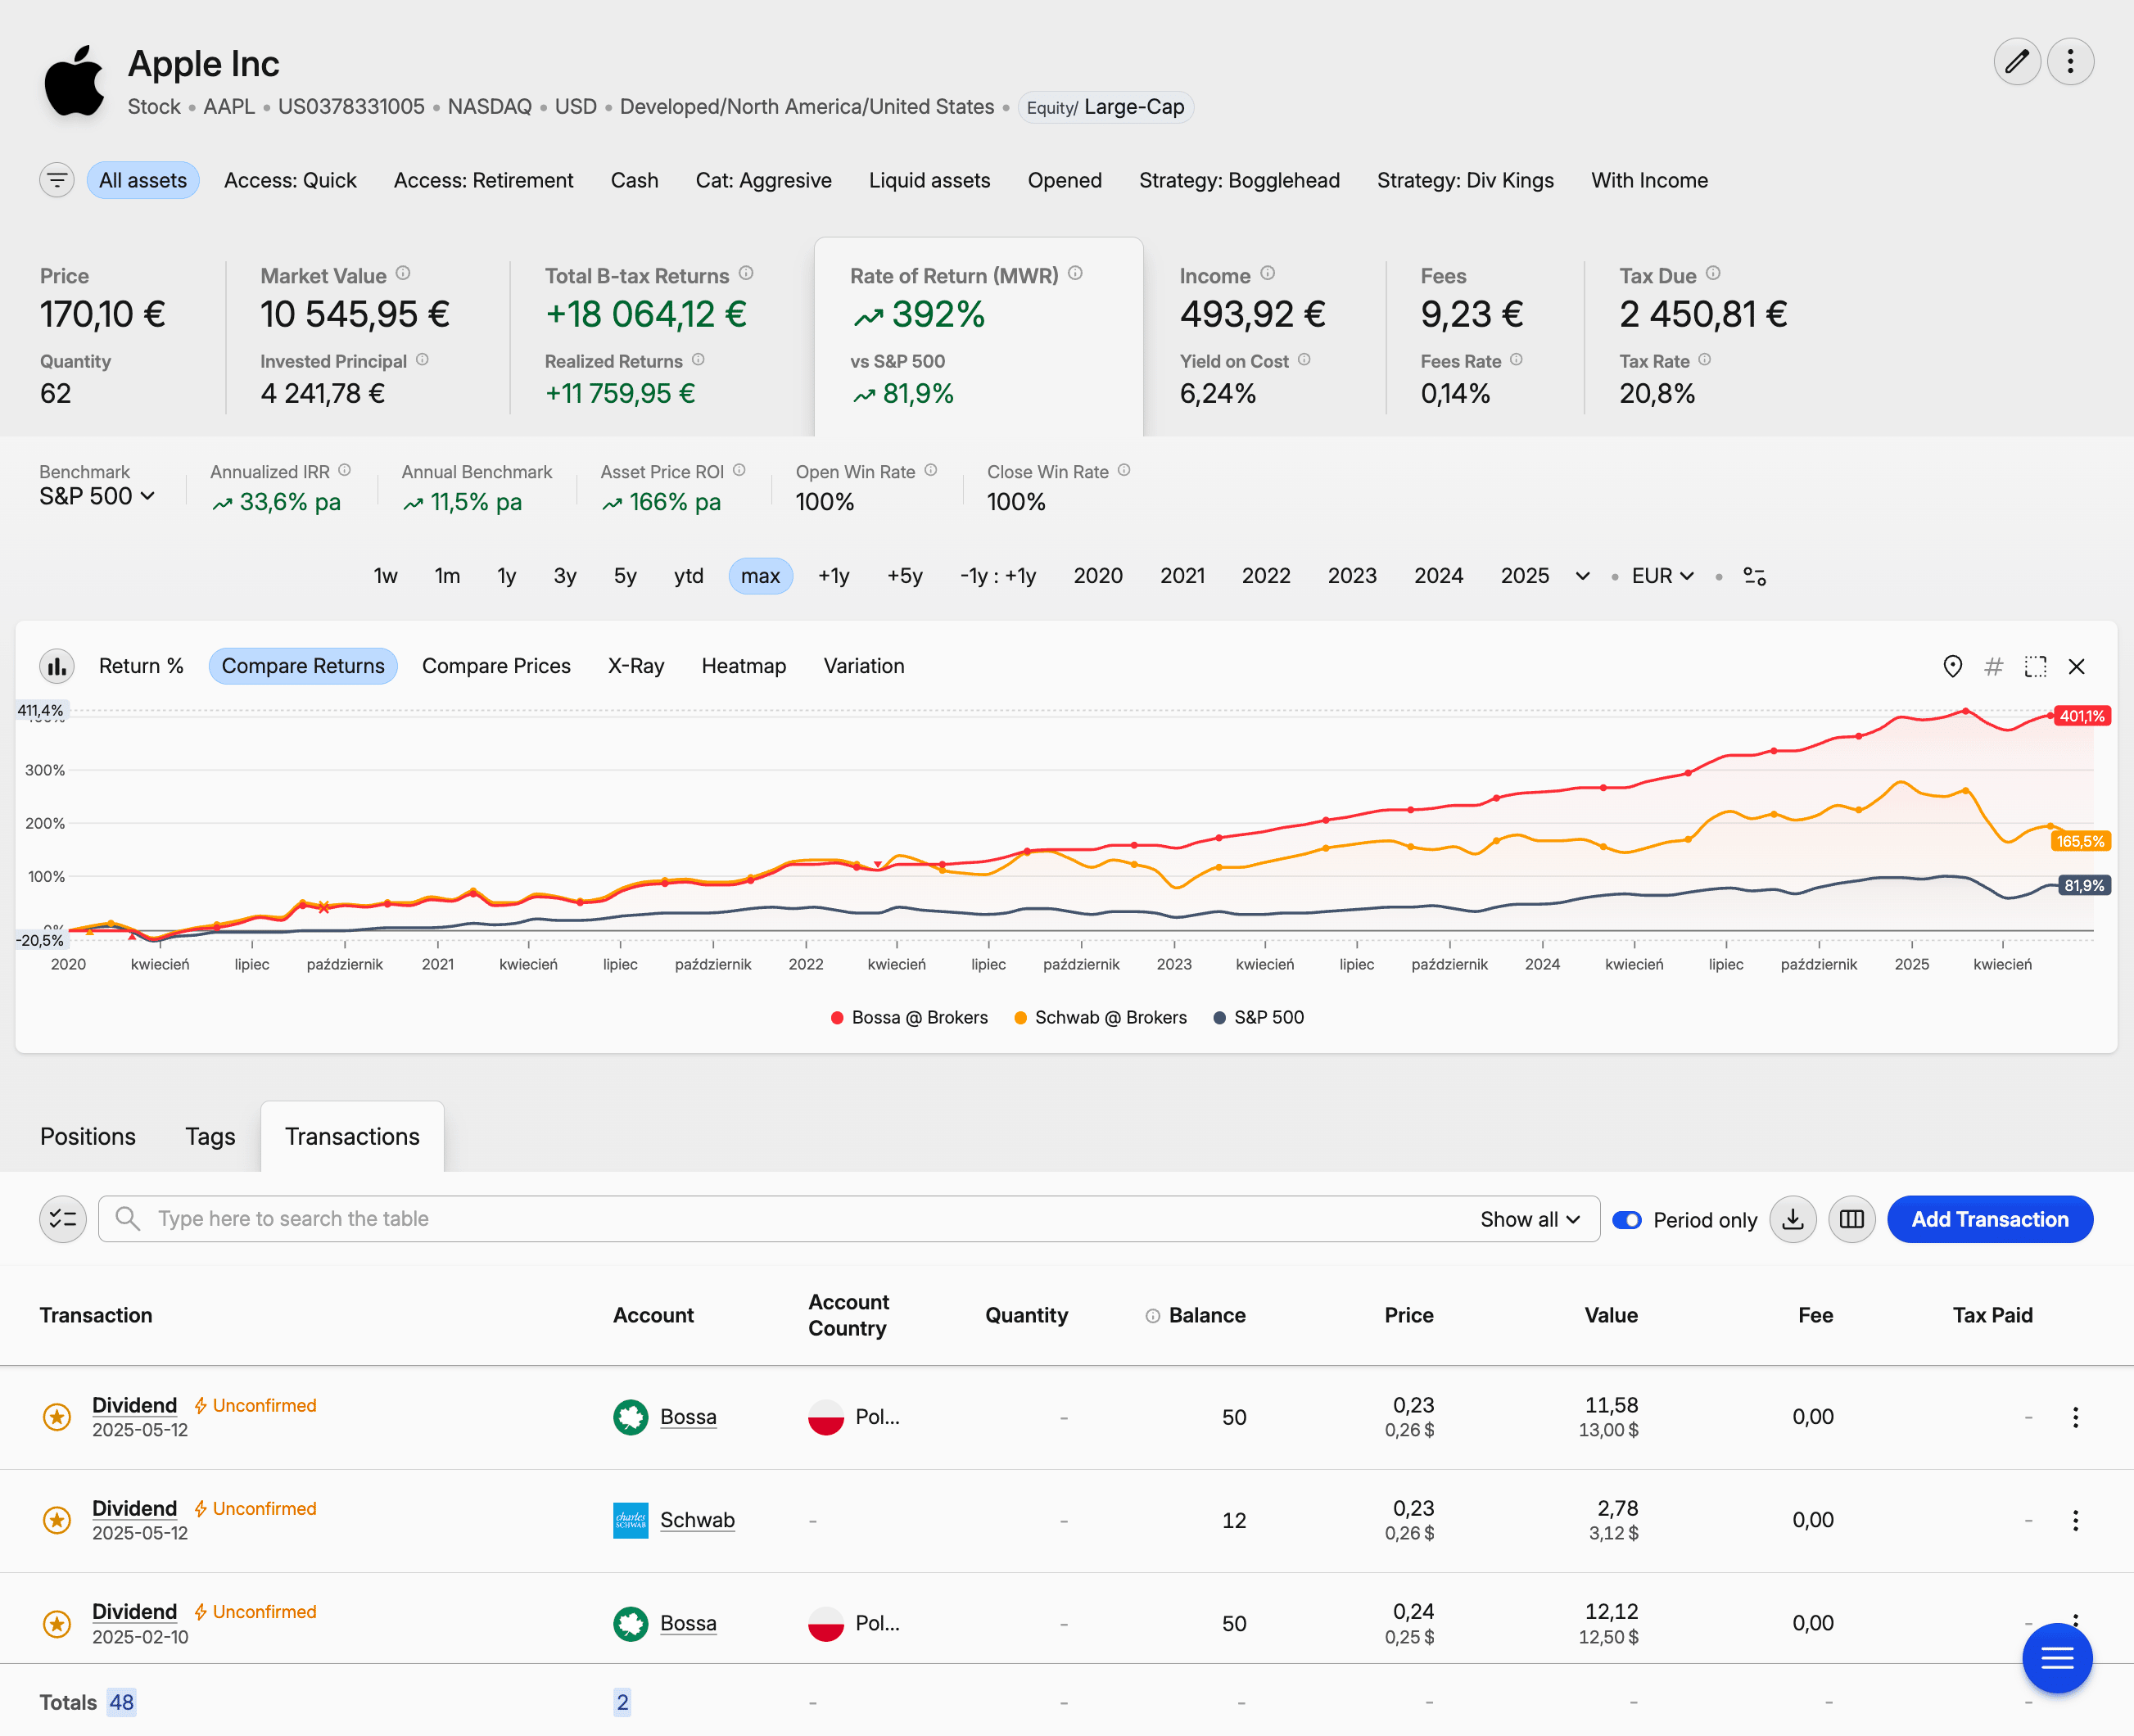 Capitally asset page
Data import: aggregator sync vs broker statements
Snowball Analytics collects data automatically: connect an account through the Yodlee aggregator, SnapTrade, or its native Interactive Brokers integration, and transactions flow in — plus manual CSV import for around 15 brokers. Capitally takes the opposite stance: it imports from 70+ brokers, exchanges, and apps, but you upload the broker's own statement rather than linking the account. More setup upfront; more accuracy and privacy in return.
Snowball's automated syncing is genuinely convenient. Connect once, and new transactions appear on their own. As of January 2026 it also offers a native Interactive Brokers integration alongside the Yodlee and SnapTrade routes. For mainstream brokers and banks, this works well — though the level of detail varies: some connections deliver full transaction history, others only current balances. Smaller European brokers, international accounts, and alternative-investment platforms often aren't covered, and automated feeds sometimes miss cost-basis information or mislabel transaction types, which creates problems at tax time.
Capitally's manual approach looks like more work, and at first it is — you export a statement from your broker and upload it. But broker statements are official records: prices, dividends, and splits are then handled automatically, and the data is accurate enough to file taxes from. The custom importer is where this pays off for non-standard sources. If your private equity fund sends quarterly statements in its own format, you build a column-mapping importer once — with support for formulas and on-the-fly price fetching — and reuse it every quarter. Imports can be reviewed before they're committed, undone in one click, and re-run. Import preset variants let one preset target multiple accounts without re-mapping. There's no aggregator linking, by design — which is the privacy tradeoff working in your favour.
Multi-currency support and international investing
Both platforms handle multiple currencies, but only Capitally separates currency return from capital return. Snowball Analytics converts everything to a base currency for reporting — clean, but it hides how much of your gain came from currency moves. Capitally keeps a dedicated currency-returns metric, so a US stock that rose 15% might show as 10% from the stock itself and 5% from a stronger dollar.
For international investors, that breakdown is the difference between knowing your strategy worked and knowing the dollar did. Capitally preserves the local-currency truth — transactions, prices, and fees can all mix currencies, and you can switch your viewing currency at any time without losing the underlying numbers. It supports any national currency, thousands of cryptocurrencies (any of which can act as a transactional currency, including custom tokens or gold!), and user-defined custom assets with manual pricing.
Snowball Analytics supports multiple currencies for accounts and assets and converts to your chosen base currency using daily FX rates. You can switch the viewing currency between supported national currencies. What it doesn't offer is currency-vs-capital attribution — the report tells you that you're up 15%, not why.
 Snowball returns overview
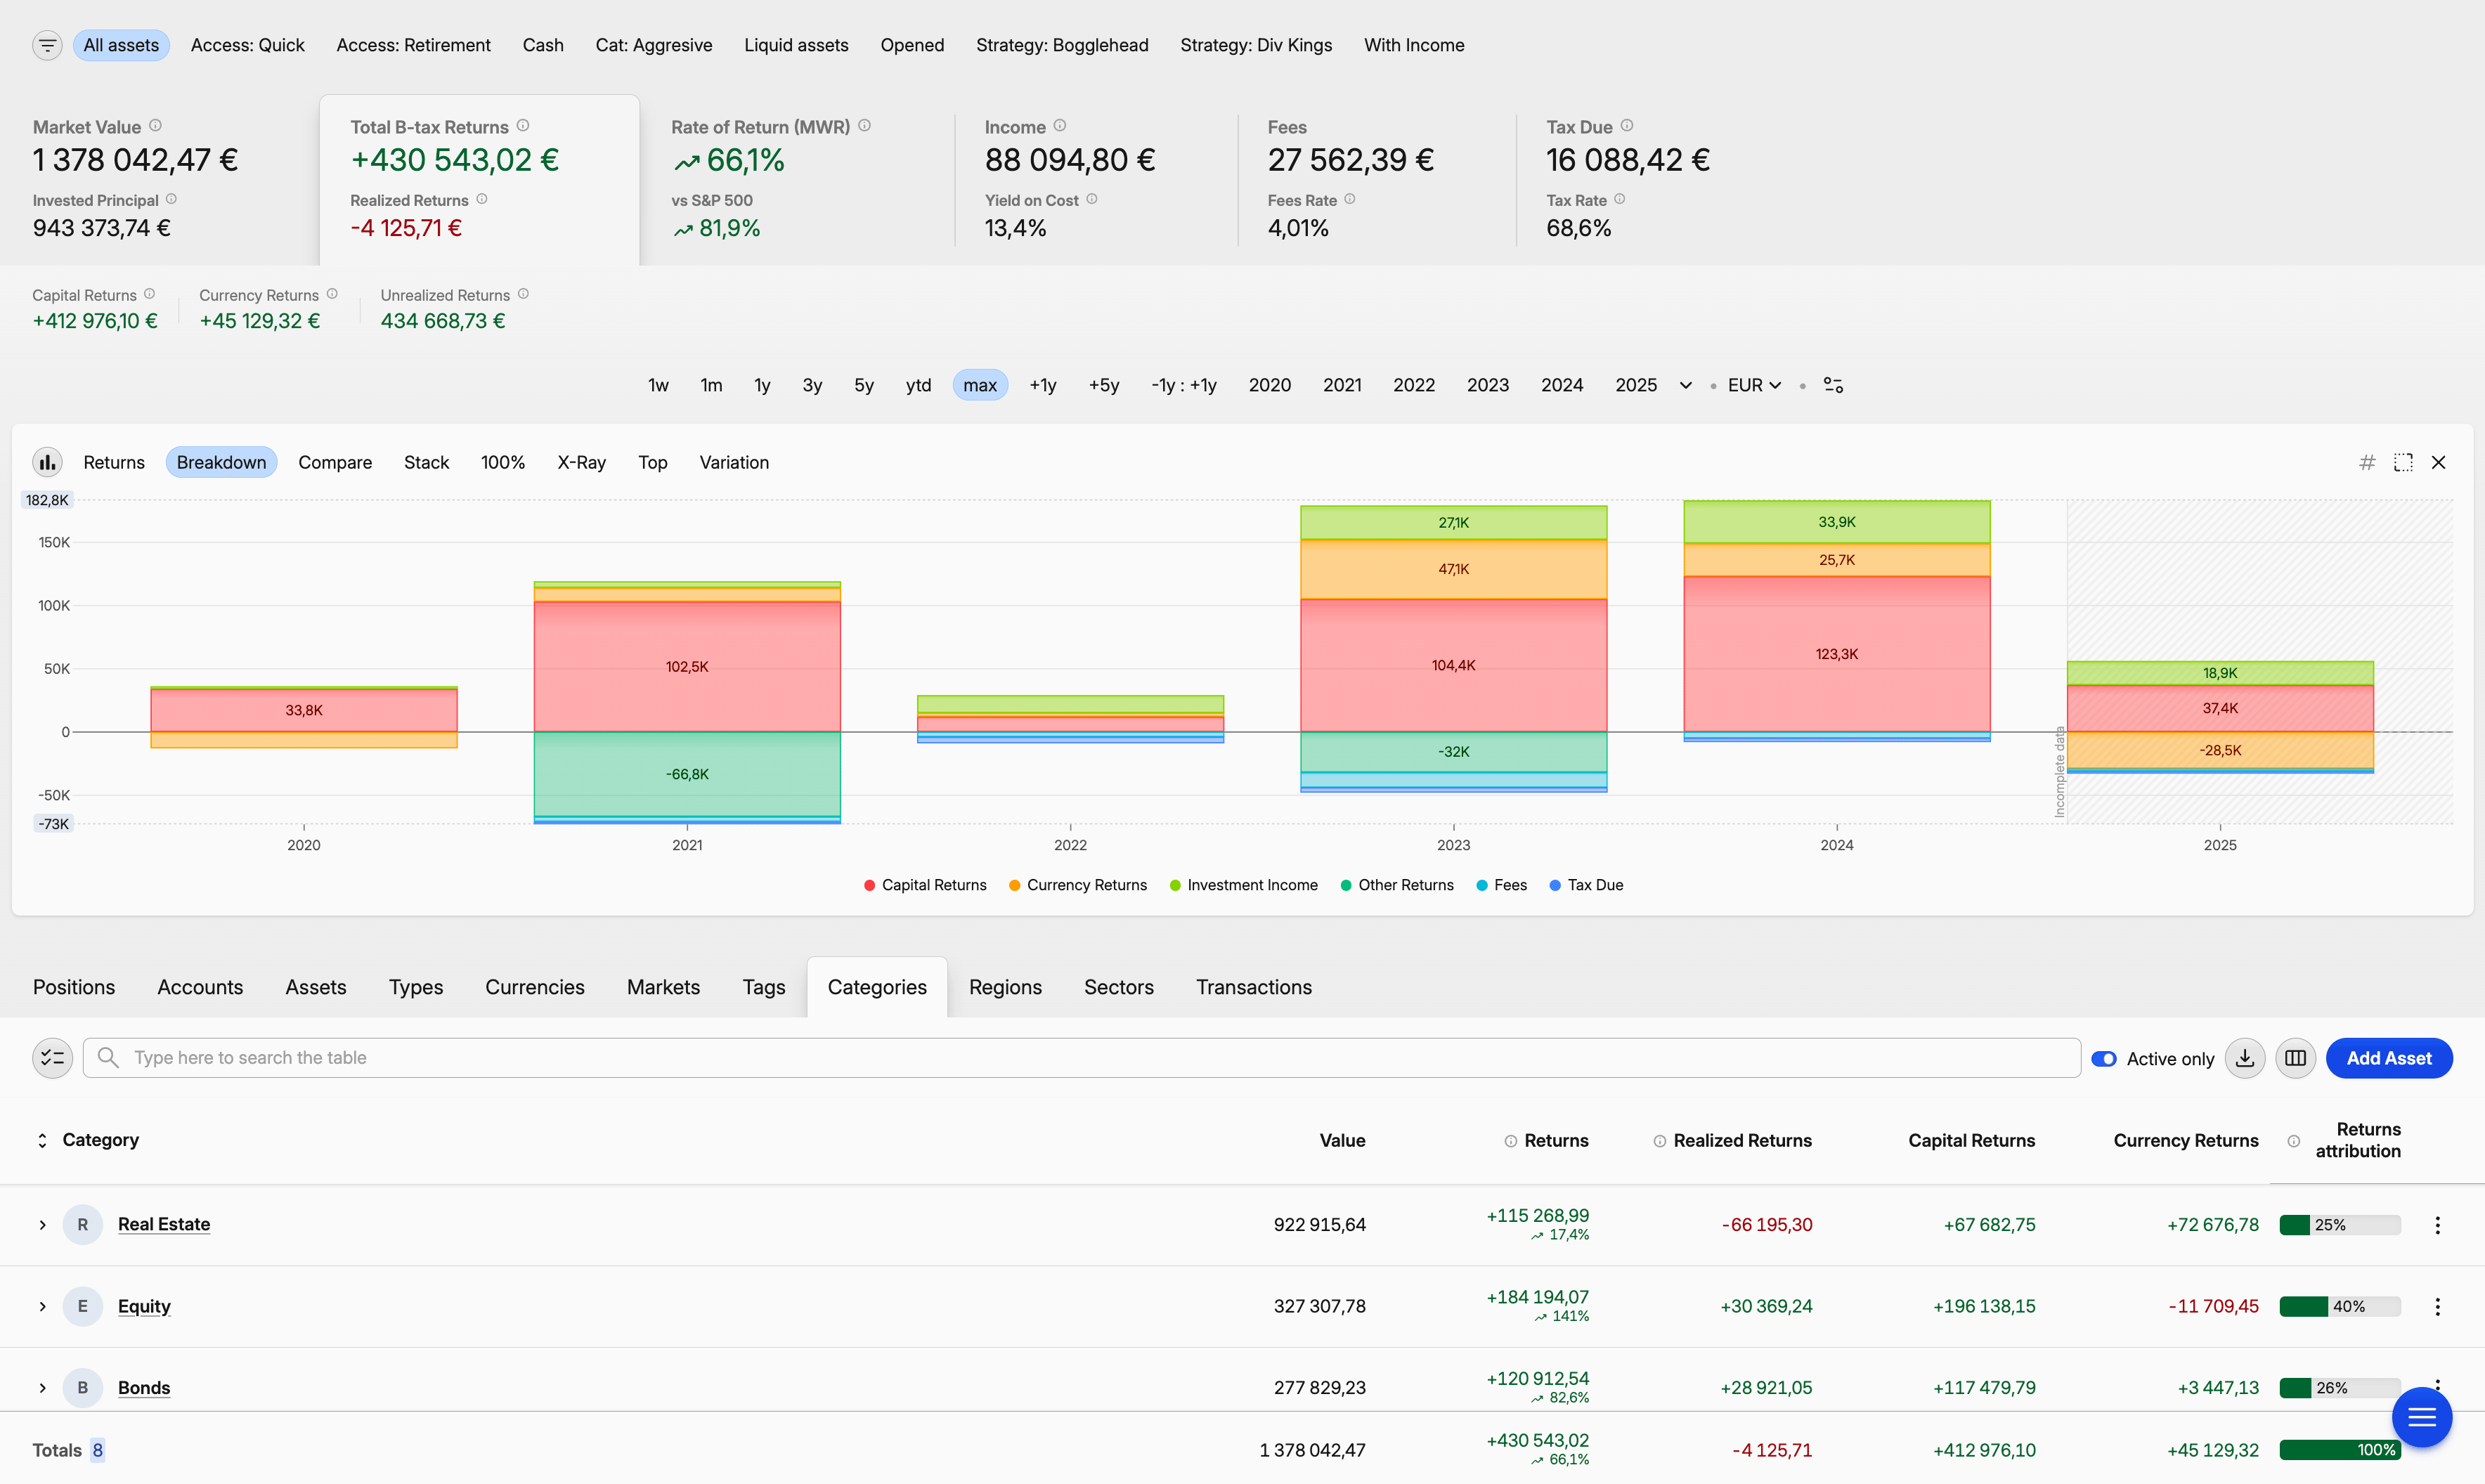 Capitally returns breakdown
Performance analysis and reporting
Capitally goes deeper on analysis. Both platforms compute the core return metrics — money-weighted return (MWR), which judges your timing, and time-weighted return (TWR), which judges your strategy — but Capitally adds a pivot-table-style Portfolio Explorer, up to 10 stacked benchmarks, and the ability to discount any return by inflation or an index to show real returns. Snowball Analytics offers a solid library of pre-built reports instead.
Snowball Analytics gives you numerous predefined reports — dividend income by month, asset allocation by sector, risk-adjusted return, Sharpe ratio — filterable by date, account, type, and category, with optional benchmark overlays. They cover standard analysis well. The limits: you can't save a customized version of a report, and you can't compare groups of assets against each other, only filter them one at a time.
Capitally centres analysis on the Portfolio Explorer — imagine a pivot table fused with charting and deep filtering. Want to compare your European real estate against your US stocks, but only for positions held longer than two years? You build that view, save it as a bookmark, and pin it to your menu. Custom charts (line, stacked, bars, volatility, X-Ray, heatmap, treemap) work over any period or metric.
Benchmarking shows the philosophical gap. Snowball lets you stack multiple benchmarks on its higher tiers (Investor and Expert), using any market-traded asset; Free and Starter are limited to index funds. Capitally lets you stack up to 10 benchmarks at once — any mix of indexes, ETFs, custom assets, account folders, or subsets of your own portfolio. It also offers a position-prices benchmark: a hypothetical buy-and-hold version of your own portfolio that answers "what would my return have been if I hadn't traded at all?" — compare against it to isolate exactly how much value your trading activity added. And a built-in library of economic indicators (CPI, house-price indexes, central-bank policy rates, bond yields, and GDP for 60+ countries, sourced from Eurostat, the OECD, and the World Bank) can be used as benchmarks — or to discount any return metric down to its real, inflation-adjusted value.
 Snowball category allocation
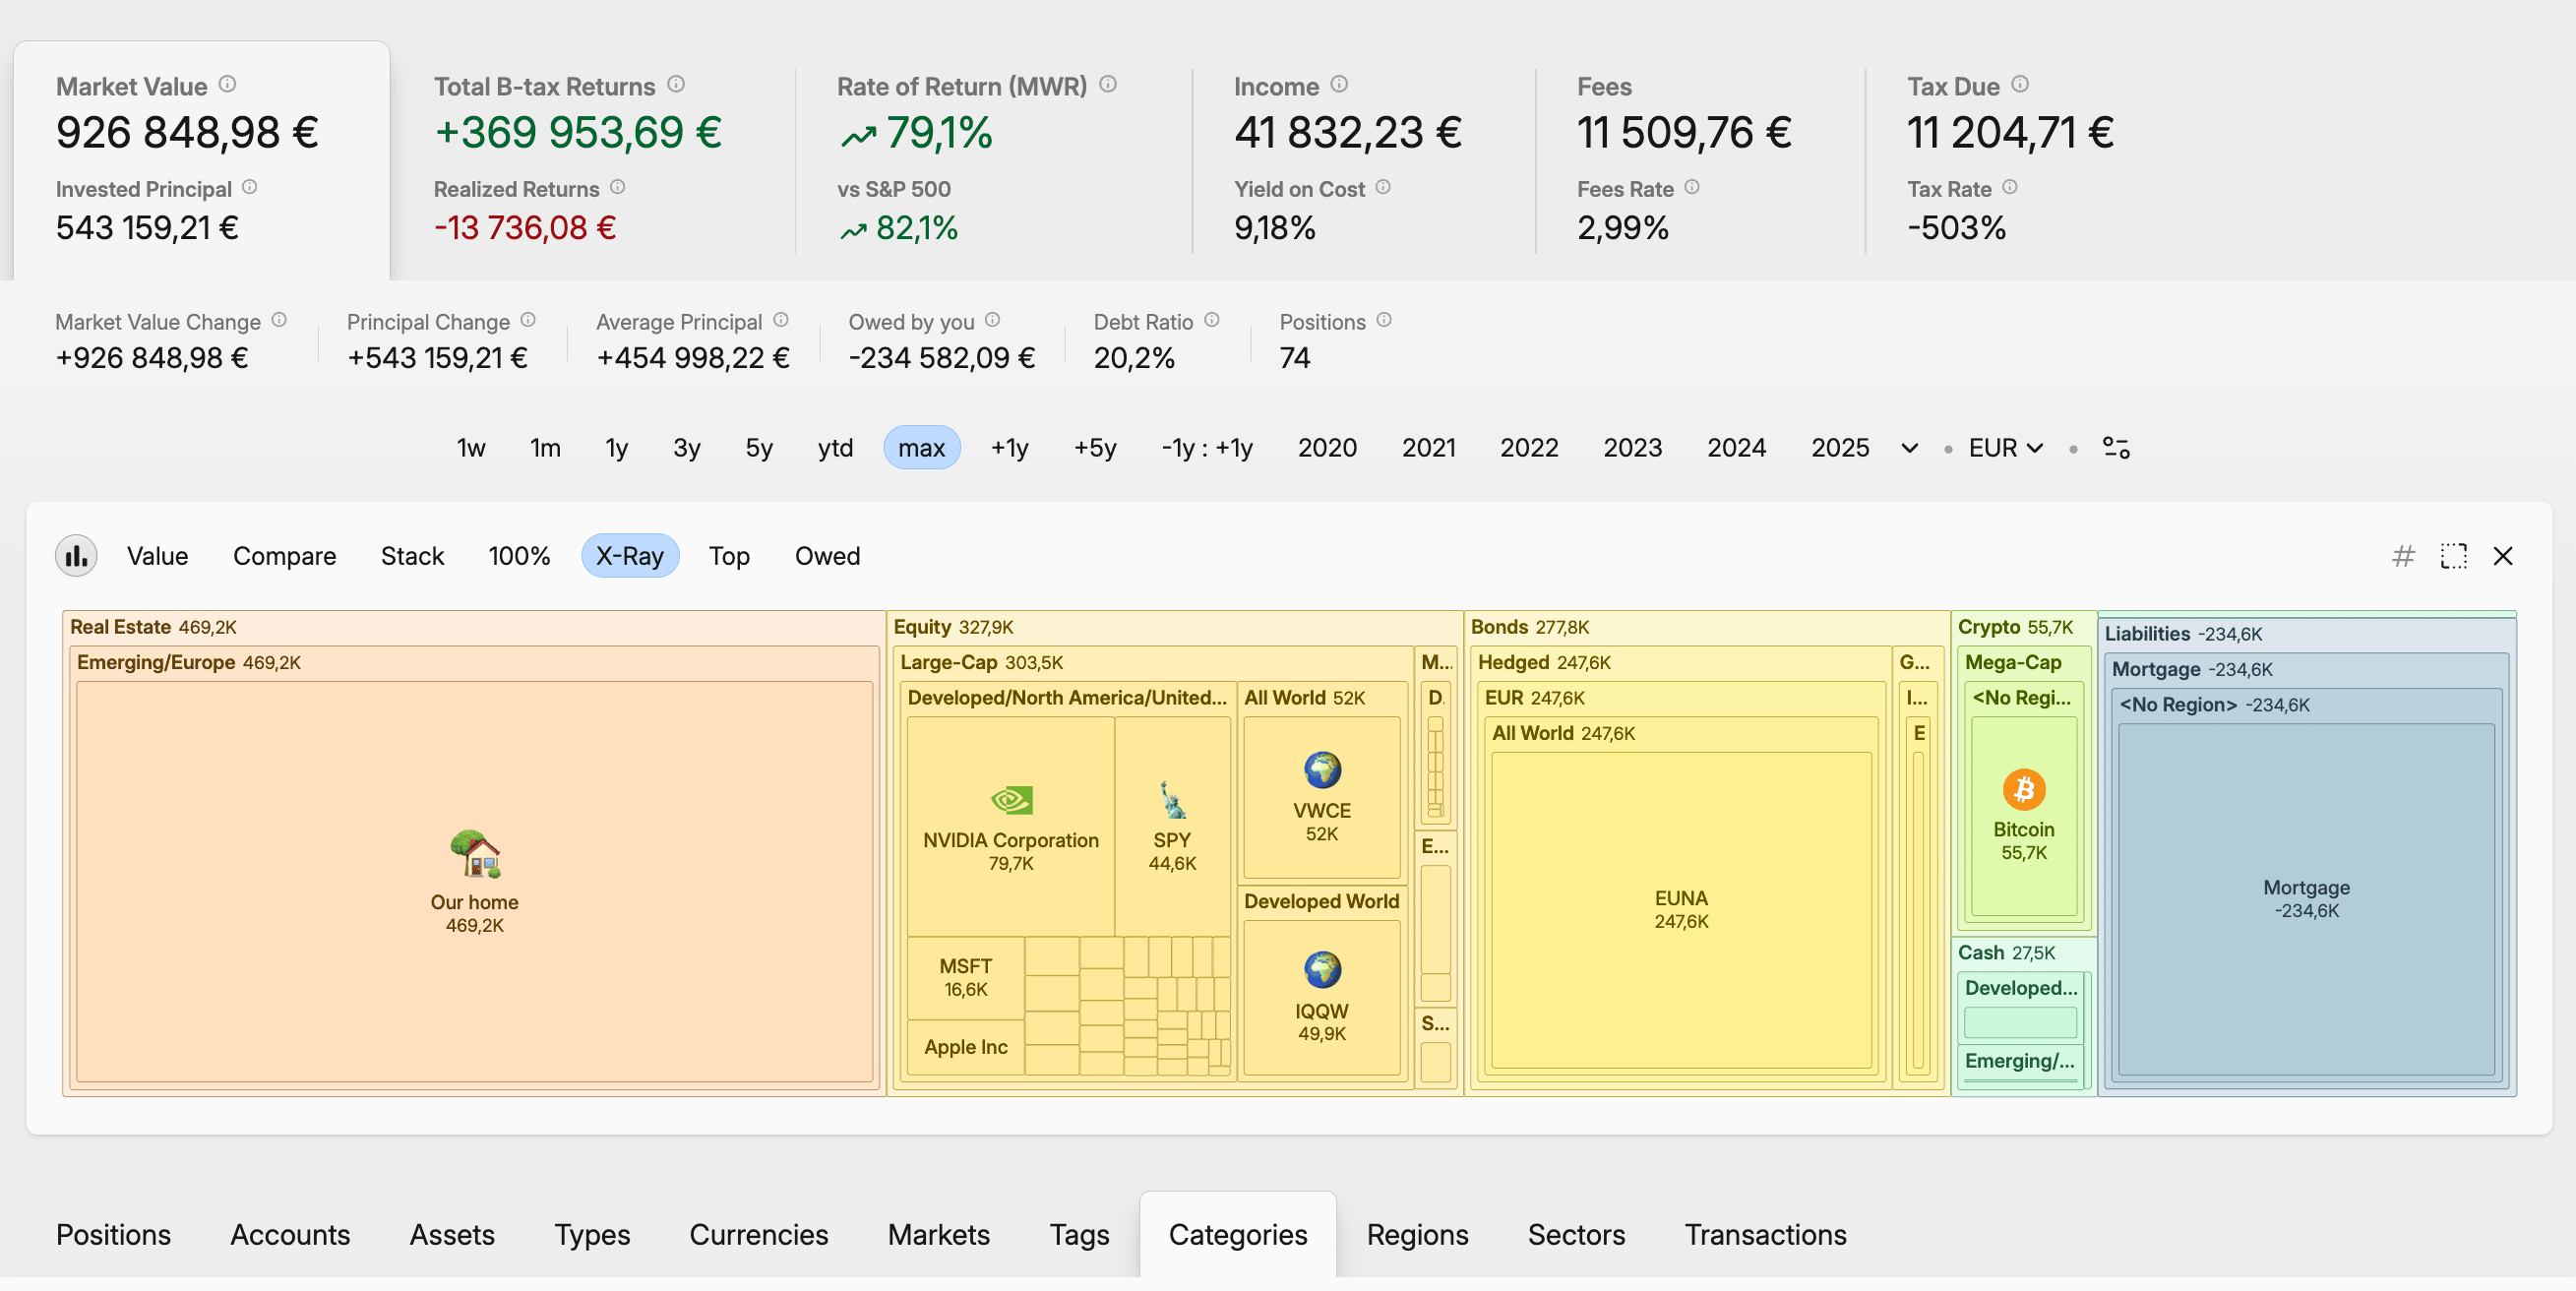 Capitally category allocation
Tax reporting and cost basis
Capitally is built for this. The cost-basis method — FIFO, LIFO, Highest Cost, Lowest Cost, Average Cost, or manual lot selection — is configurable per asset, account, or position. Average Cost in particular matters for Canadian investors and for UK investors subject to Section 104 pooling rules. There are ready-to-use capital-gains presets for the US, UK, Netherlands, Poland (both D-1 and D+1 conventions), Czechia, Australia, Belgium, Canada, Germany, France, and Sweden — each with the right holding-period rules and crypto handling — plus a preset editor with a live report preview for anything custom. Tax-loss harvesting includes a Harvestable-quantity column that tells you exactly how many shares to sell for a target tax benefit. Calculations are settlement-date-aware and respect national holidays, and there's a dedicated tax report to file or hand to your accountant.
Snowball Analytics records withholding tax on dividends and can recalculate it from your saved tax parameters, and composite portfolios inherit their tax-rate settings from the underlying portfolios. But its own documentation is explicit that there's no support for tax lots or cost-basis valuations — and in February 2026 it merged its "Cost basis" and "Average Price" columns into one. For anyone who needs to calculate capital gains accurately, or who trades frequently and wants to manage the tax consequences, that's a real limitation.
Portfolio strategies and planning
Snowball Analytics is the more complete tool for implementing and maintaining a strategy. It offers category-based target allocations, a rebalancing calculator that tells you what to buy or sell, allocation backtesting on historical data, and goal planning that estimates your probability of hitting a target portfolio value or income. Capitally currently focuses on analysis over strategy automation — a rebalancing engine and full backtester are still on its roadmap.
Snowball Analytics lets you define target allocations across categories, then uses its rebalancing calculator to determine the trades that get you back on target. You can backtest different asset allocations against historical data — returns, dividend yield, risk metrics, diversification scores — and even copy targets from public portfolios. Its goal-planning feature sets a target portfolio value or passive-income level and calculates the probability of reaching it based on your contributions and expected returns. For FIRE-minded investors who want to model scenarios, this is genuinely useful, and it's an area where Snowball is ahead.
Capitally currently leans toward analysis rather than strategy automation. You can examine your allocation across any dimension and spot imbalances, but there's no built-in rebalancing tool or formal strategy templates yet. What you can do is create separate what-if projects to model alternative strategies without touching your main portfolio — a sandbox for "what if I'd invested differently" scenarios — and use the position-prices benchmark to isolate the impact of your trading. Interest-rate scenarios for bonds and liabilities can be modelled by adjusting the terms on those assets. According to the roadmap, more dedicated strategy tools are coming, but today, investors who want structured portfolio-strategy features will find Snowball more complete.
User experience and platform access
Snowball Analytics ships native iOS and Android apps, with home-screen widgets on iOS; Capitally is a Progressive Web App — one interface that installs on desktop and mobile and works fully offline. Snowball's interface is fixed and quick to learn but spreads across many screens; Capitally's is heavily customizable, slower to master, but moulds to your workflow over time.
Snowball Analytics offers native mobile apps alongside its web platform, including iOS home-screen widgets for payouts and performance. The apps are optimized for mobile, though they don't include every feature from the web version. The web UI is clean and dashboard-focused, and as of August 2025 the main dashboard is customizable — you choose and rearrange widgets. It's easy to learn; the tradeoff is the sheer number of screens.
Capitally takes the Progressive Web App route. The same interface runs on desktop and mobile, installs like a native app, and — importantly — works completely offline. On a flight, you can still analyze your portfolio, and that offline capability doubles as a privacy feature, since your data stays on your device. Customization runs deep: custom views, columns, charts, date periods, importers, tax presets, even menu structures. It's more to absorb at first, but there are fewer screens to master overall, and the app moulds to how you actually work.
Pricing and value compared
Snowball's tiers are Free, Starter ($7.99/month or $79.99/year), Investor ($14.99/month or $149.99/year), and Expert ($24.99/month or $249.99/year). The Free plan is genuinely limited — one portfolio, 10 holdings — but it lets you test with real data before paying. Paid tiers progressively unlock unlimited holdings, more portfolios (up to 10 on Investor, unlimited on Expert), and full benchmarking. All paid plans come with a 14-day trial, no credit card required.
Capitally's three annual plans are tiered by capacity and capability. Sailor (€80/year) covers one project with up to 50 assets — enough for many individual investors. Navigator (€130/year) raises that to five projects and unlimited assets, and adds multiple benchmarks, the position-prices benchmark, and inflation-adjusted returns. Captain (€250/year) unlocks unlimited projects plus the advanced modules — Private Equity tracking, options, and margin. There's a 14-day trial with no credit card, and your price is locked in for as long as you stay subscribed, even if list prices rise.
For complex portfolios, Capitally tends to be the better value: the €250 Captain plan costs about the same as Snowball's $249.99 Expert tier while adding options, liabilities, private equity, and deeper tax and analytics. If you mostly need automated syncing, prefer monthly billing, or want a free option, Snowball's structure fits better.
Snowball Analytics vs Capitally: which should you choose?
Choose Capitally if privacy and portfolio complexity matter to you — alternative assets, options, liabilities, multi-currency holdings, or serious tax work — and you're comfortable importing broker statements yourself. Choose Snowball Analytics if your holdings are mainstream, you want automated account syncing and native mobile apps, or you need built-in rebalancing and goal-planning tools. Both are capable; the right answer depends on your portfolio and your priorities.
Capitally is the better fit if you:
- hold alternative assets — real estate, private equity, art, P2P loans — and want them tracked as real asset classes, not generic placeholders
- use leverage or carry debt, and need liabilities in your net-worth picture
- trade options, or invest across multiple currencies and want FX separated from capital return
- have real tax needs — specific cost-basis methods, multiple jurisdictions, tax-loss harvesting
- want your financial data end-to-end encrypted on your own device, with no aggregator and no ad trackers
Snowball Analytics is the better fit if you:
- hold mainly stocks, ETFs, and funds at mainstream brokers, and want them synced automatically
- prefer native mobile apps and quick on-the-go check-ins
- want structured strategy tools out of the box — rebalancing, allocation backtesting, goal and FIRE planning
- like the option of starting on a free plan, or paying month to month
- value a gentle learning curve over deep customization
Both platforms are actively developed and solve the core problem — seeing your whole portfolio in one place. Snowball Analytics does it with automation and structure; Capitally does it with privacy, asset breadth, and analytical depth. If you're weighing other options too, our guide to the best portfolio tracker for the modern DIY investor puts both in wider context.