Hello there! 👋 Let's get you up and running with Capitally - get a unified view of your investment performance across multiple accounts and asset types.
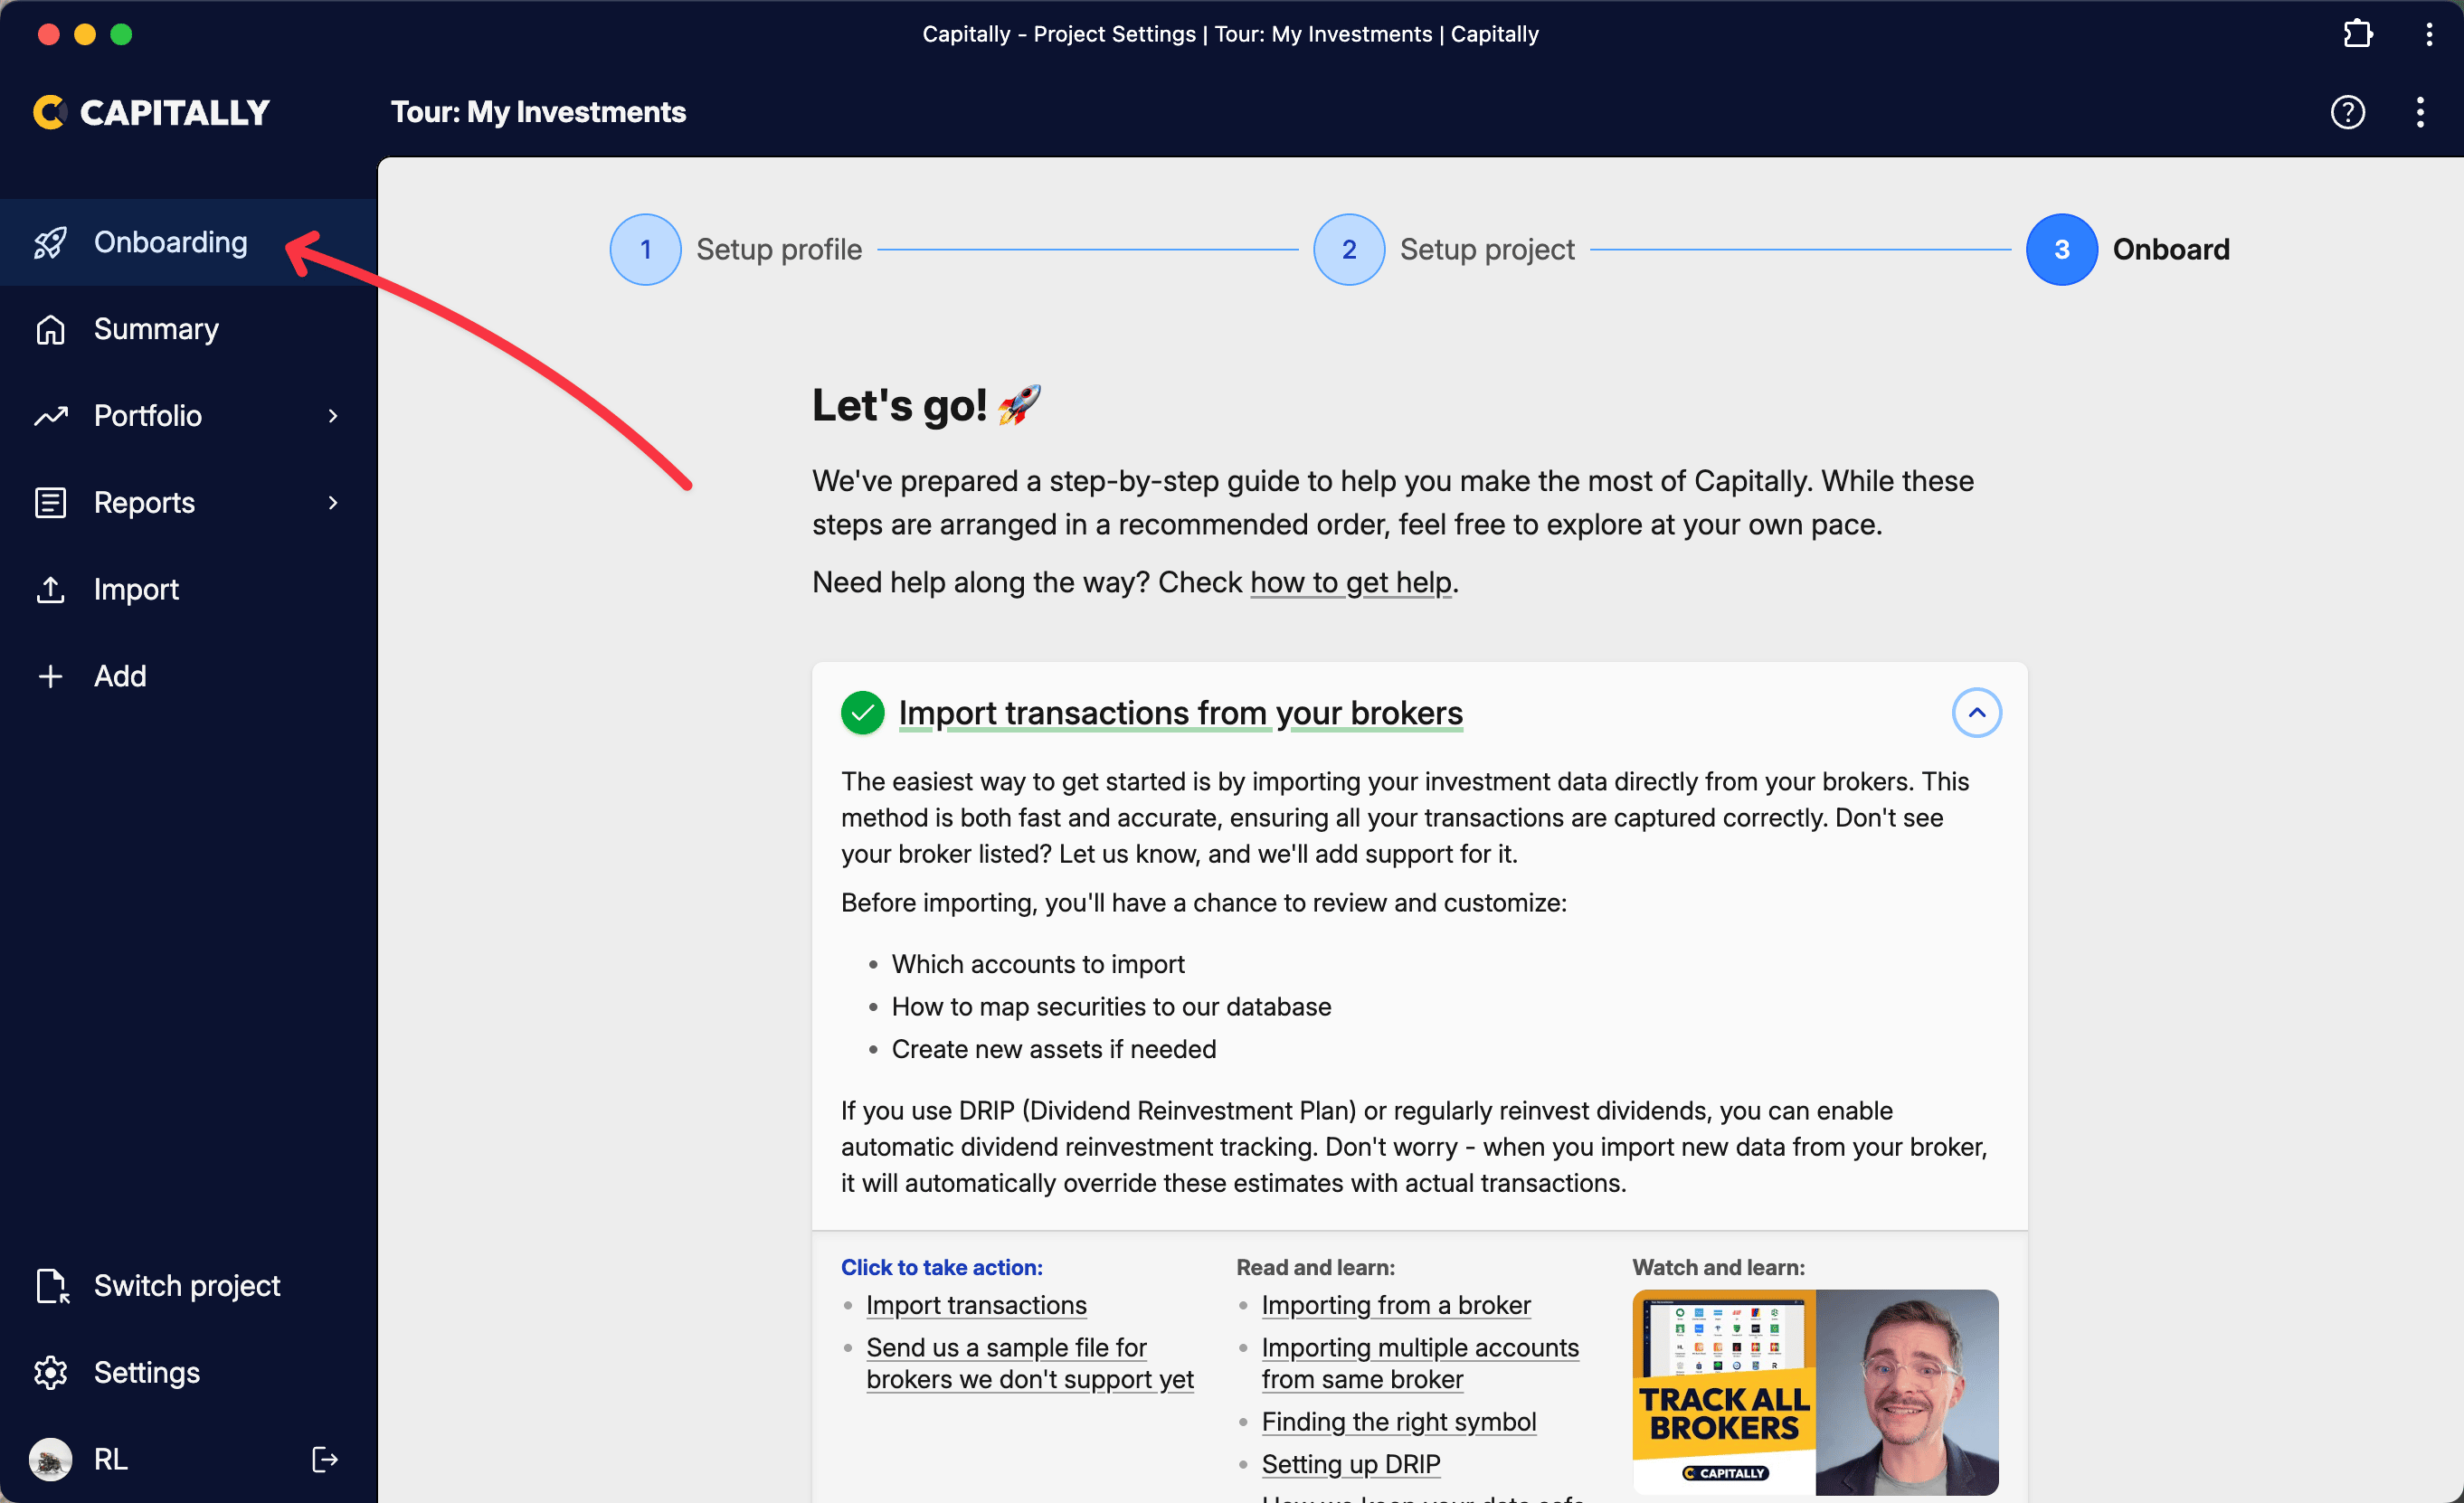
First of all - there's the Onboarding section right within the app, that will guide you through the process with articles and how-to videos relevant to what you want to track.
If you want to binge-watch all our onboarding videos - check out this video playlist. 🍿
Help articles
Capitally has a setup guide for every asset type it tracks. Open the ones that match what you hold — each covers how to add the asset, what you can import, and the metrics that apply to it.
- Stocks & ETFs
- Cryptocurrencies
- Cash Accounts
- Real Estate
- Bonds & Deposits
- Mutual Funds
- Options
- Precious Metals (Gold & Silver)
- Employee Equity (RSUs, ESPP, stock options)
- Ventures, Startups and Passive-Income
- Private Equity
- Collectibles, Valuables, Art
If you encounter any issues while importing, check out Import problems.
Projects, accounts and settings
Everything you track sits inside a project: accounts, assets, transactions, tags, and the Project half of Settings — General, Analysis, Benchmarks, Taxes and the rest. The Profile half — interface language, number and date formats, subscription, privacy — belongs to your login instead, and follows you into every project you open.
Most setups need exactly one project, with accounts and account folders separating brokers, entities or family members inside it. Nothing crosses between projects — a second one starts empty, and no report can span two.
- Projects — creating, switching, renaming and deleting them, and when a second one is worth it.
- Organizing your portfolio — accounts, folders, tags and taxonomies.
- Settings and display preferences — interface language, number and date formats, whether cents are shown, and the cookie consent that lets Capitally reopen the project you last worked in.
- Your account and signing in — signing in with Google or email, and what to do when the app opens on an empty portfolio.
How to View Your Data
Capitally has two screens for reading your portfolio, and they answer different questions. Summary is what the app opens on: fixed tiles covering the whole project — what you own, what it has returned, what it pays you. Portfolio is where you take those numbers apart, by account, asset type, tag or period.
Portfolio is the section worth learning first. From it you can group and filter positions, switch the viewing currency, add a column for any metric, compare yourself to benchmarks, and save any arrangement you return to as a bookmark. What those columns hold — Invested Principal, Market Value, and how the returns split into capital, currency and realized — is defined in the Portfolio metrics reference.
Remember, it's completely fine if you don't get everything at once. Take your time, explore the app, experiment, use Undo and watch as you become a confident user of Capitally.
And if you get stuck along the way - let us know - we are here to help.